Here at ZenPayroll, we care a lot about how compensation is done, and the effect compensation can have on the relationship between employers and employees. Using the employment data we have as a payroll provider, we decided to look at whether the 1099 economy, which has garnered quite a bit of media attention recently, is really growing as fast as people think.
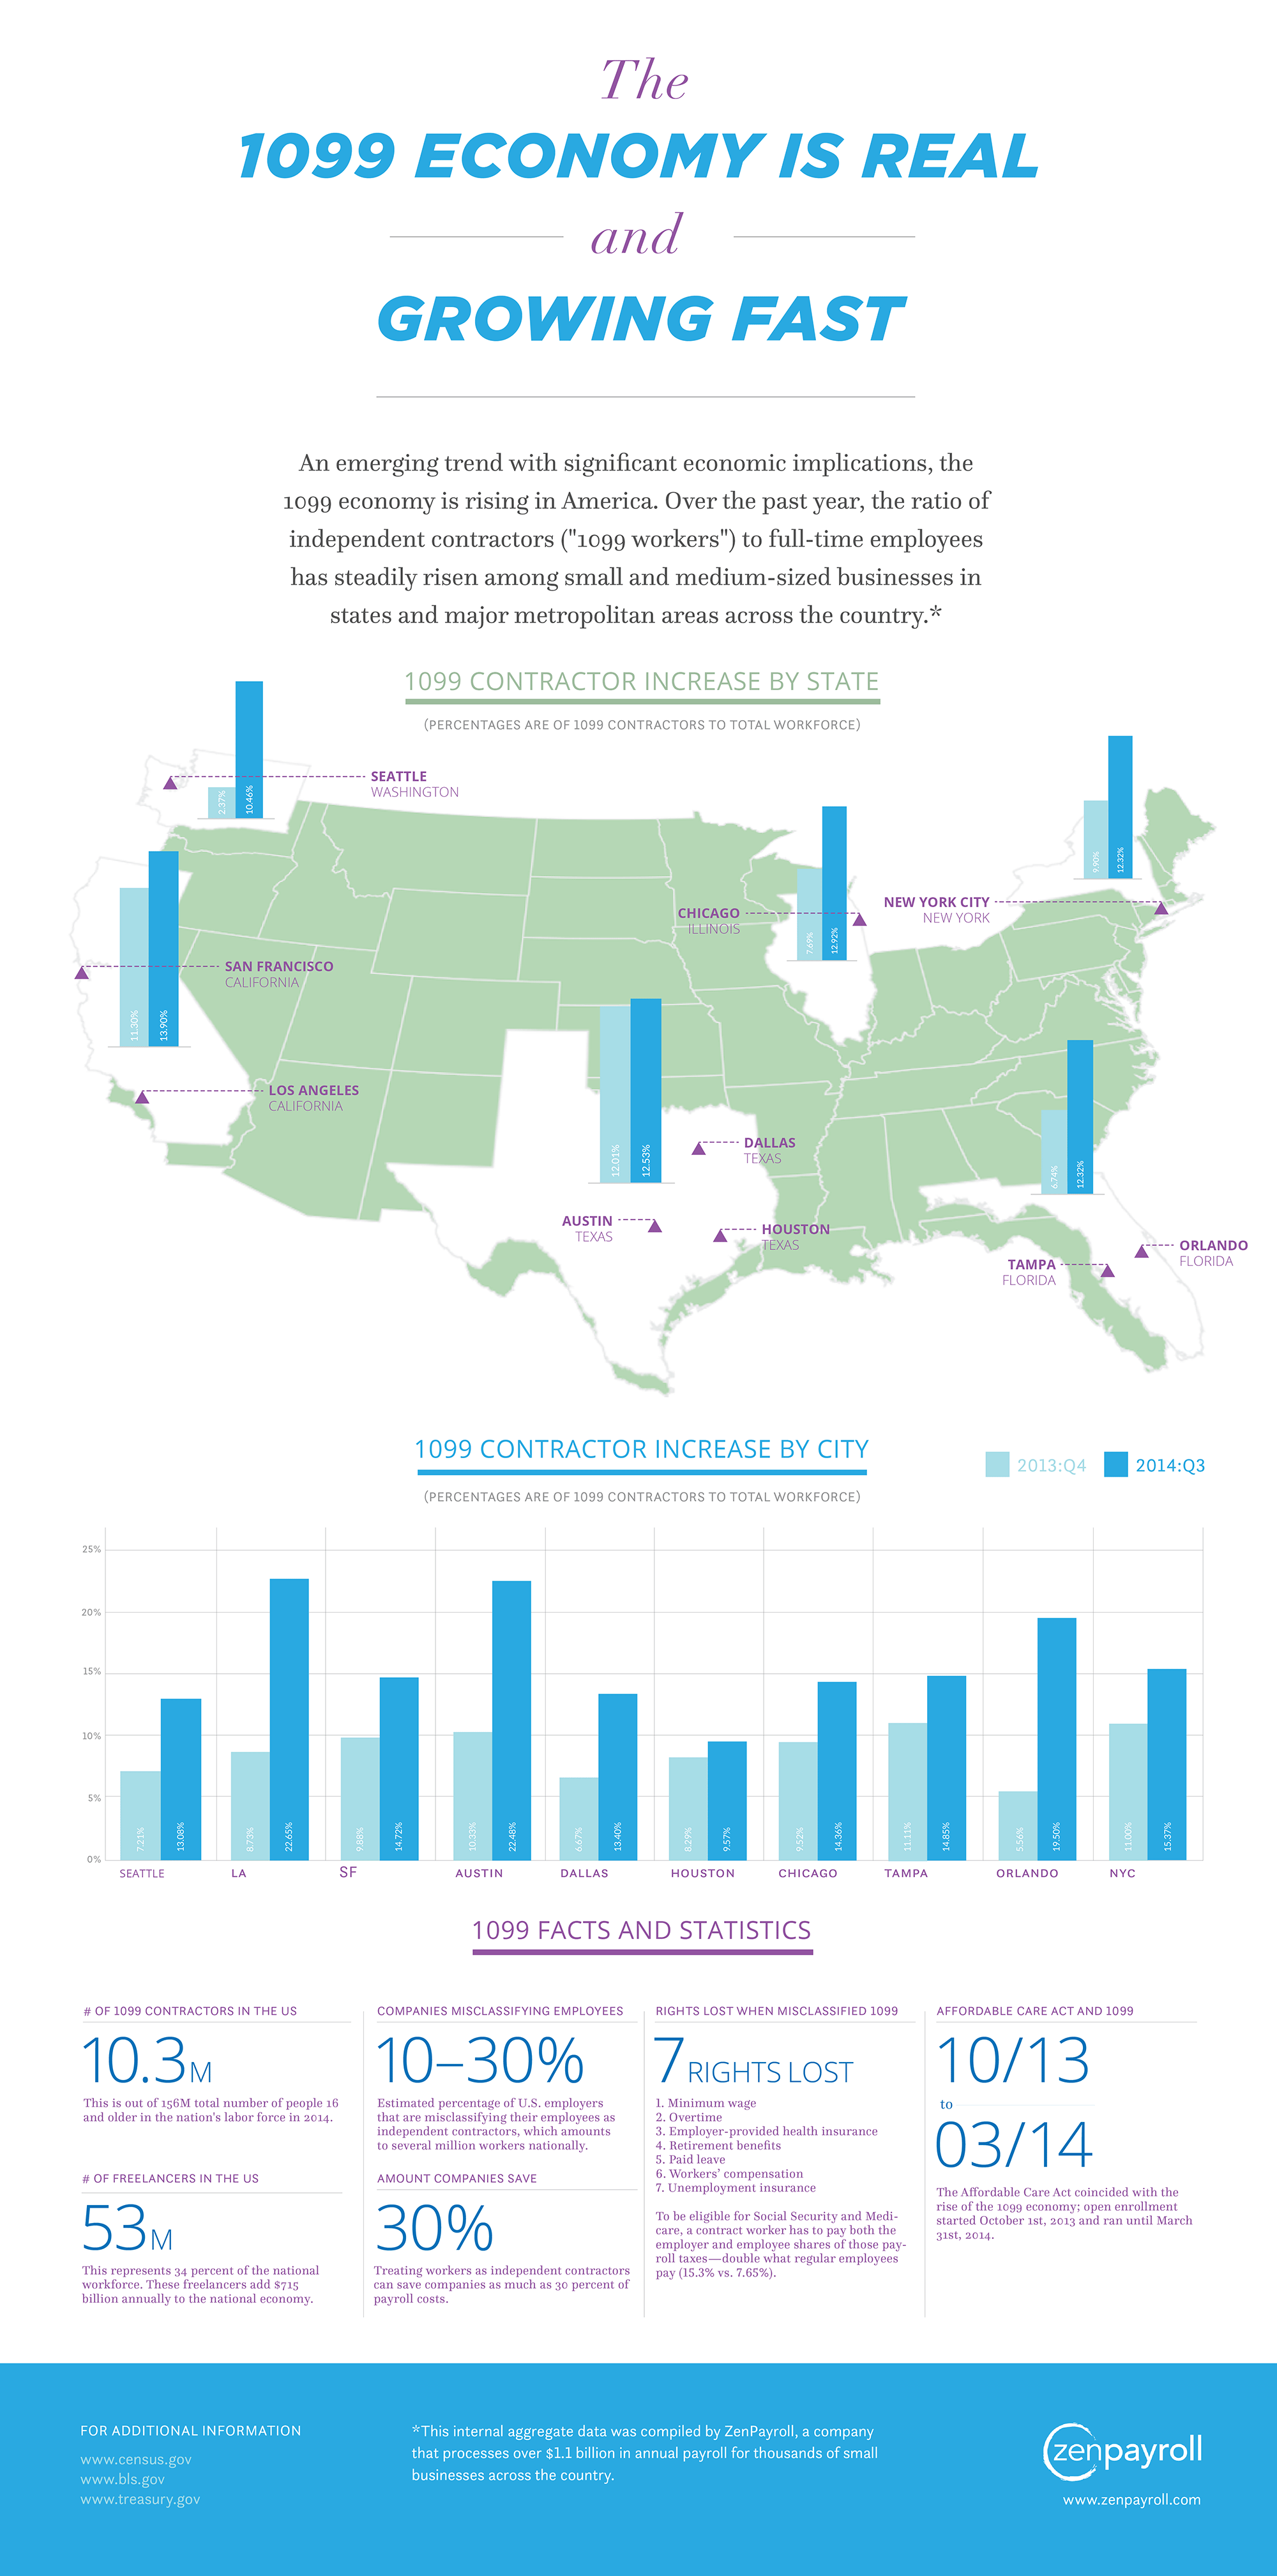
The short answer is that over the past year, the ratio of independent contractors to full-time employees has meaningfully risen among small and medium-sized businesses in states and major metropolitan areas across the country.
The nature of work is changing given the decline of lifetime employment. Today, very few people plan to work for the same company their whole life, and people often have several jobs at one time. As a result, and as shown by ZenPayroll's data, more small business owners are employing contractors as a part of running their business. There are a number of other reasons for this general trend toward a more flexible work structure.
Click the image to enlarge.
First, employees want to have more choices when it comes to where and when they work, but also who they work for. Millennials in particular are frequently asking themselves whether they're fulfilled by what they're doing. Jess Ostroff, founder of a full-service virtual assistance agency called Don't Panic Management, said that some of her contractors in New York City are aspiring actors, and they do contract work to support themselves as they pursue longer-term passions and ambitions.
Others do contract work purely for the flexibility -- one of the first contractors to work for the Don't Panic Management team is a mother of three who has her own cooking show and also runs a photography business. She supplements those jobs by contracting so she can earn money while spending time with her family.
For some entrepreneurs, hiring independent contractors is key to their business. Lina Pakrosnyte is the founder and owner of UrbanLeash, a professional pet care company based in Chicago. There are four full-time employees on her team, but she works with over 30 contractors for tech and marketing help, as well as dog walking and cat sitting. With the high turnover in pet care professionals, Lina needs to keep finding contractors to serve her UrbanLeash clients.
I've also talked to many small business owners who prefer having a remote or distributed workforce. Adam McLane, founder of a youth ministry resources company called The Youth Cartel, is one example. Because his business requires expert writers and public speakers, he works with over a hundred contractors from all over the country to produce content and events.
After the economic downturn several years ago, many people who lost their full-time jobs found contract and part-time work as a way to fill that gap. When times are uncertain, employers also tend to prefer contractors. With the government promising to crack down on employers who misclassify their workers as contractors rather than employees, it's important for business owners to know the distinction between the two. We published a post recently on the ZenPayroll blog to help small business owners avoid misclassifying their workers.
The future isn't set in stone, and there will be ongoing debate about the responsibility employers have towards their workers, whether they are employees or contractors. It is important to care of your people if you want to attract and retain great talent.


