“California Commuters Continue to Choose Single Occupant Vehicles,” according to a report by the California Center for Jobs and the Economy. The Center indicated:
“The recent release of the 2014 American Community Survey data provides an opportunity to gauge how California commuters have responded to this shifting policy. The data clearly reflects that even with the well-documented and rapidly rising costs of the state’s traffic congestion and costs associated with the deteriorating condition of the state’s roads, California workers continue to rely on single occupant vehicles for the primary mode of commuting. Moreover, their reliance on this mode of travel continues to grow both in absolute and relative terms (emphasis in original).
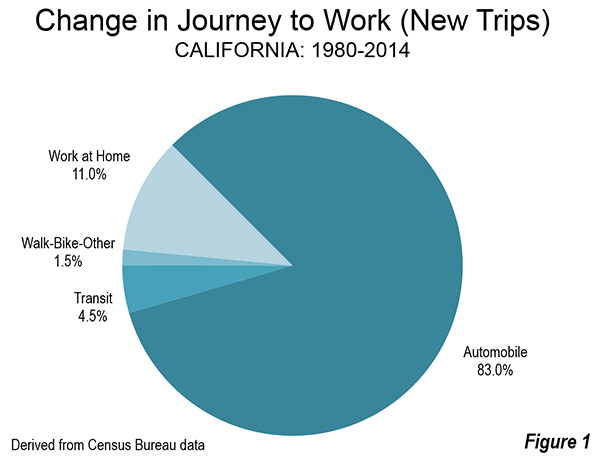
California has experienced substantial growth since 1980. There are approximately 7,000,000 more workers today than 35 years ago. The Census Bureau data shows that 83 percent of the new commuting has been by single-occupant automobile. Working at home accounted for 11 percent of the new commuting, while transit accounted for less than one half that figure, at 4.5 percent (Figure). In 1980, transit accounted for more than three times the volume as working at home. By 2014, the number of people working at home exceeded that of transit commuters.
The Center noted that state policies to discourage single-occupant commuting had been of little effect:
“The substantial investments in public transit, bike lanes, and other alternative modes have not produced major gains in commuter use. Instead, these investments appear to have simply shifted the choices made by commuters who already are committed to getting to work through modes other than single occupant vehicles. From 1980 to 2000, public transit use grew by 116,000 while “other” modes dropped by the same amount. From 1980 to 2005, public transit use grew by 121,000 while “other” modes dropped by 113,000. In the following years, 1/3 of the growth in public transit and “other” modes was offset by reductions in carpool use.”
The report credited impressive public transit gains in the San Francisco Bay Area, but went on to say that:
“even in the Bay Area, growth of public transit and the “other modes” has come largely from the shrinking relative use of carpooling.”
While improving transit ridership is a good thing, to the extent that it removes passengers from car pools, there is no gain in traffic, because the car and driver are still on the road.
The report laid considerable blame on the cost of houses in California:
“California, the growing body of land use, energy, CEQA, and other regulations affecting housing cost and supply has put both the cost of housing ownership and rents within traditional employment centers out of the reach of many households.”
California’s housing affordability is legendarily desperate. Since the imposition of strong land use regulations began in the early 1970s, the median house price has risen from three times (or less) times median household incomes in of the state’s metropolitan areas to over nine times today in the San Jose and San Francisco metropolitan areas, over eight times in the Los Angeles and San Diego areas and over five times in the Riverside-San Bernardino area (Inland Empire).
Perhaps the most important “take-away” from the report was that: “The current de facto policy of trying to reduce commuting by increasing congestion and its associated costs to commuters has to date not shown itself to be successful.” Simply stated, the vast majority of jobs and destinations in all of California’s urban areas are not accessible by transit in a reasonable time. The question for most California commuters is, for example, not whether to drive or take transit to work, but whether to go to work at all, since most jobs are not readily accessible except by car.