NewGeography.com blogs
California High Speed Rail officials and the Governor’s office seem to be suffering from selective hearing. Lawmakers and experts at the University of California’s Institute of Transportation continue to challenge the high-speed rail project’s viability due to precarious statistical projections on ridership and cost. One wonders if developers will reconsider upon hearing California treasurer Bill Lockyer’s recent criticisms.
Lockyer’s first major issue lies with the basics: the ability to raise enough capital from private sources needed to complete the project. The Rail Authority claims it would need $10 to $12 billion from private investment alone, although some analysts think that, like most of the monetary figures associated with the rail line, this number will ultimately grow. Investors are reluctant to fund such a risky venture, as nothing proposed in this project has proven stable or certain. If investors do indeed close their checkbooks, there is no way the Rail Authority will complete the project.
Lockyer doesn’t think selling the idea in smaller chunks would work either. He questions the willingness of anyone to buy state bonds for the HSR, even though voters approved $9.95 billion worth in November 2008.
Despite these reservations, Governor Schwarzenegger is protecting the funding promises made in the 2008 ballot measure. The Rail Authority is also ignoring the warnings of Lockyer and others. They are also trying to start building in the Bay Area in order to meet deadlines for federal funding. But the way things are going, it looks as if federal funding is all they will get. As more and more powerful people add their names to the list of skeptics, the high-speed rail line seems that much closer to complete failure.
Rather than overriding their critics and spending money they may not get, the Rail Authority should invest in consumer confidence. They need more concrete plans and more promising statistics to create a market for this line because right now, most think the project will turn out to be nothing more than a huge budgetary debacle.
Looking for a business-friendly state? You had better skip California. Extensive regulations, high taxes, and high worker’s compensation rates have made California unappealing for resident and out-of-state businesses alike in the past two years. However, according to the business relocation coach, 2010 marks an economic “emergency” as there have already been 84 instances in California of companies either closing their factories, moving their headquarters out of state, or investing heavily in another out-of-state location. This nearly doubles the 2009 total of 44 instances, and more than doubles the 2006-2008 total of 35. California is losing its economic luster at an alarming rate, which does not bode well for job seekers.
Some of the companies moving or hedging their bets by shifting operations elsewhere include Google, Apple, Genentech, Facebook, and Hilton. Orange County, Los Angeles, and Santa Clara counties have suffered the most in 2010 with 25, 19, and 16 company moves respectively. Santa Clara in particular houses some of the big tech names like Google, Hewlett Packard, and Apple. In 2009, Los Angeles had the largest number (and the only county in double digits) of company moves with 12. California is not only losing out economically, but it is also losing some of its character as the technology-hub of the US.
This exodus follows recent trends emerging during the recession. The states benefitting most from California’s high taxes and strict regulations include Texas (with 18 events), Colorado (17 events), Arizona (11 events), Nevada (10 events), and North Carolina (10 events). Increasingly, these states have established themselves as promising havens for job seekers and have fared better during these tough times.
The state that once drew thousands of hopeful migrants during the Great Depression is now stifling growth opportunities. This is a bleak and unfortunate reversal, particularly for a place struggling to stay afloat in the recession.
For years, the United States has been portrayed by both international and domestic interests as an environmental outlaw, because of its high rate of greenhouse gas (GHG) emissions. The United States, Canada and Australia have the highest GHG emissions per capita in the world. Further, the United States has historically had the highest overall GHG emissions, until having recently been passed by China.
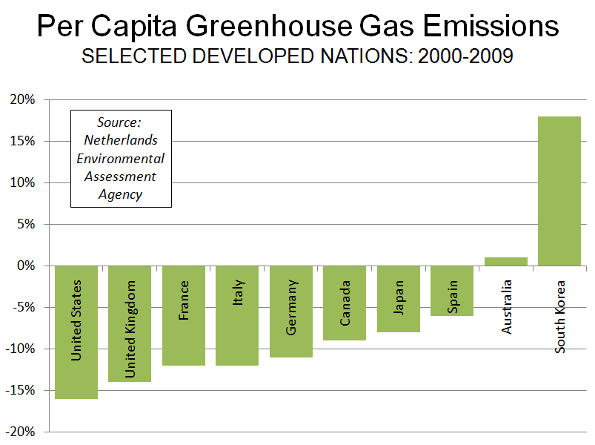
It is likely to come as a surprise that the US has become a model for its reduction in GHG emissions over the last decade. According to a report by the Netherlands Environmental Assessment Agency, GHG emissions per capita fell more in the United States from 2000 to 2009 than in any other area reviewed. The Agency also reported that there had been no growth in global GHG emissions in 2009.
Per capita GHG emissions fell 16% in the United States from 2000 to 2009. This is half again as large as the 11% reduction in the highest income portion of the European Union (EU-15). Among EU-15 nations for which data was provided, per capita GHG emissions were down 14% in the United Kingdom, 12% in France and Italy, and 11% in Germany. Spain, where economic reality is forcing a reduction in support for its highly touted "green" energy program, reduced per capita GHG emissions by little more than one-third the US rate, at 6%. The Netherlands achieved a 3% reduction (Figure).
In both the United States and Europe, the deep recession contributed to a reduction between 2008 and 2009. Between 2000 and 2008 (pre-recession), US GHG emissions per capita declined 9%, while EU-15 emissions declined 7%.
Canada's GHG emissions declined 9% from 2009 to 2009, while Japan's per capita GHG emissions declined at one-half the US rate (8%). Australia's emissions rose 1%, while emissions per capita rose 18% in South Korea.
 GHG emissions per capita increased in all of the developing nations surveyed except for the Ukraine (-12%) and Brazil (-1%). Such increases are not surprising, as people in developing nations move from the countryside to urban areas and as they seek greater affluence. GHG emissions per capita increased in all of the developing nations surveyed except for the Ukraine (-12%) and Brazil (-1%). Such increases are not surprising, as people in developing nations move from the countryside to urban areas and as they seek greater affluence.
There was more good news for the United States. Biofuel use in road freight transport was more than double that of the European Union (EU-27). This is significant because road transport volumes in the EU-27 are nearly the same as in the United States.
Photograph: Southern Greenland (by the author)
In the lead up to the G20 conference, the security costs were projected to approach a billion dollars. As high as this number sounds, sources are now speculating that the total bill could be closer to $2 billion. Shocking as that number is, the costs incurred by local businesses may have exceeded that total.
In addition to the physical damage to the hundreds of shops that were smashed in, there were major productivity losses during, and in the week before the conference. The most visible opportunity cost was the sharp decline in retail sales. According to Monaris Solutions, businesses within the security barrier saw a 28.08% decline in sales, and a 40.87% decrease in transactions. Businesses outside of the barrier experienced a 10.78% decline in sales, and a 16.43% decrease in transactions. The total city decline in sales was 9.31%, with 14.96% less transactions. This may not seem like that much, until you consider that the city has $47 billion in annual retail sales. A crude calculation puts the total retail losses in the $386 million range for the 25-27th. Given that this is a summer weekend, it is probably a low estimate.
The implicit costs to the financial sector would be difficult to tabulate. With 223,000 employees, even minor disruptions to the sector are extremely costly. Many of the large banks asked their employees to work from home for several days, which certainly caused some level of productivity costs. Many of them also had to temporarily move their trading floors outside of the downtown core. Moreover, each bank needed to prepare its employees for the inevitable disruptions during the conference. As the security boundaries shifted, and government policies to deal with the conference changed, banks were required to hold multiple meetings in preparation. Assuming each meeting lasted a half hour, and the average employee earns $20/hour (an understatement), the financial sector would have lost roughly over $2 million for every single preparatory meeting.
Unfortunately, it is impossible to calculate the full cost of the summit to Toronto businesses. The banks have been fairly quiet about their own costs, likely because of the Harper government’s strong stand against implementing a global bank tax, a move that would have devastated the global financial sector. Though there have been no public statements from the banks, there are rumors circulating that the financial sector lost at least as much as retailers. Those same rumors have it that the overall economic losses exceeded the security costs (based on the original security estimates). With nearly $400 million in retail losses alone, this seems realistic. Let’s hope this G20 experience has finally put to death the myth that hosting controversial global political meetings in major cities brings economic benefits.
If one measures a state’s popularity on the cost of U-Haul rentals, then Ohio is losing out to the sunny Florida beaches big time. The one-way rental fees for a 26-foot U-Haul truck show a significant disparity in the cost to go from Florida to Ohio and the cost to go from Ohio to Florida. The rate for going from Miami to Cleveland is $1,000 compared to $1,457 if the destination was swapped, resulting in a 45.7% premium to leave Ohio. That percentage still pales against the 50.4% premium to go from Cleveland to Tampa or the whopping 56% premium to go from Cleveland to Orlando. U-Haul is offering deep discounts for Ohio-bound travelers, which hopefully for Ohio, will attract more people.
This is not unique to Florida either. U-Haul rates to go to and from states like Texas and Pennsylvania reflect the same pattern. Some speculate that Ohio’s higher taxes are to blame for the exodus, but who knows; maybe Ohioans just want a change of scenery.
|


