
Three weeks ago I wrote a piece about the role that a “Rust Belt Diaspora,” or the people who relocated from Rust Belt to Sun Belt states over the last 50 years, could play in Rust Belt revitalization. In that piece I noted that there are many people who seek to maintain a connection with where they (or their parents) used to live, and that’s partly expressed by fan support in major professional sports leagues. I used the example of Detroit Lions fans nearly equaling the number of hometown fans in Phoenix, Houston and San Francisco last season, reckoning that they weren’t all traveling from Michigan to see the Lions.
Also in that piece, I did a back-of-the-napkin estimate of Rust Belt to Sun Belt migration from 1970-2020. My estimate, if accurate, would outpace any significant domestic migration pattern ever seen in the U.S. – dwarfing the Great Migration, Dust Bowl, perhaps even America's westward expansion following the Louisiana Purchase in 1803 and continuing for the next century.
It’s worth posting here again so you can understand the scope:
_________________________
For the past few weeks I’ve been trying to find research that quantifies Rust Belt to Sun Belt migration. Seems to me there’s an academic or PhD candidate who wrote a paper on the outflow of residents from the Northeast and Midwest to the South and Southwest from, say, 1970-2020, but I haven’t found it. So I decided to make a crude estimate. Let’s see how it works.
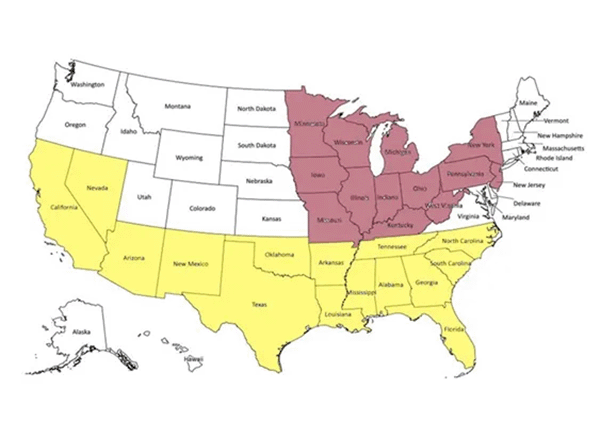
I set out to look at population growth figures for all 50 states between 1970-2020. I classified all 50 states by what I determined to be their Rust Belt, Sun Belt and non-Rust/Sun Belt type. Using my judgement I categorized 13 states as Rust Belt, 15 states as Sun Belt, and the remaining 22 as neither. You can see how I designated them on the map below. It’s one version of a Rust Belt/Sun Belt framing at a state level; your map may look different:
My next step was to analyze decennial population growth for the designated Rust Belt and Sun Belt states, and compare their growth rates with the total growth rate of the U.S. over the same period. In this step I found that between 1970-2020 the total population of the U.S. grew by 63%, from 203.4 million to 331.4 million. That works out to a 10.3% increase per decade.
Of course, we know that the nation’s growth wasn’t distributed equally, so I grouped the states by their designated categories and analyzed their growth rates. The Sun Belt-designated states grew by 119% over the same period, averaging a 17% increase per decade. Non-Sun/Rust Belt states grew by 67% over the period. Their growth rate of 10.9% per decade is essentially the same as the 10.3% rate for the U.S. overall. The Rust Belt states? They grew by just under 19% between 1970-2020, or about 3.5% per decade.
Read the rest of this piece at The Corner Side Yard.
Pete Saunders is a writer and researcher whose work focuses on urbanism and public policy. Pete has been the editor/publisher of the Corner Side Yard, an urbanist blog, since 2012. Pete is also an urban affairs contributor to Forbes Magazine's online platform. Pete's writings have been published widely in traditional and internet media outlets, including the feature article in the December 2018 issue of Planning Magazine. Pete has more than twenty years' experience in planning, economic development, and community development, with stops in the public, private and non-profit sectors. He lives in Chicago.
Photo: A black swan in Australia, via wikimedia.org Credit: Flagstaffotos, under CC 3.0 License.


