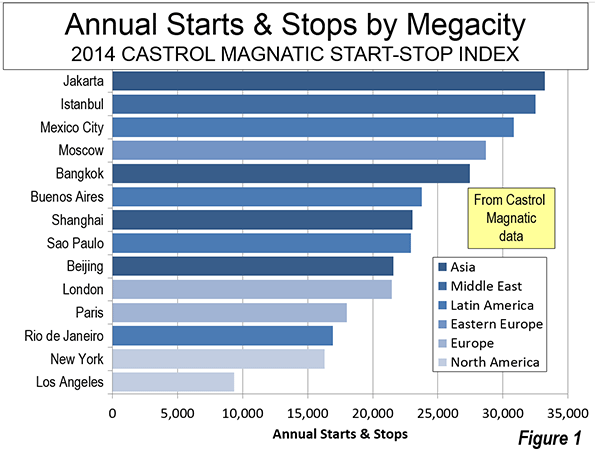
The world's second-largest city, Jakarta, is its most congested according to the Castrol Magnatec Stop-Start Index. The Start-Stop Index estimates the average number of starts and stops per vehicle in 78 cities around the world. Jakarta drivers had 33,240 starts and stops annually according to the survey. A higher number of starts and stops is associated with more intense traffic congestion and more intense greenhouse gas emissions per mile traveled. This is an indication of a roadway system that provides insufficient capacity for the travel demand (including commercial truck traffic). The Start-Stop Index did not include the world's largest city, Tokyo–Yokohama.
Measuring Traffic Congestion
The Castrol Magnatic is one of three international traffic congestion measures that provide information over broad geographical areas. The other two indexes, the Tom Tom Traffic Congestion Index and the INRIX Traffic Scorecard provide measures of traffic congestion by travel time losses. These indexes generally follow the method pioneered by the Texas A&M Transportation Institute, the results of which are reported annually in its Urban Mobility Report.
The Castrol Magnatic Start-Stop Index measures congestion by the number of starts and stops experienced by drivers. The three traffic congestion indexes also measure different geographies. The Tom Tom Traffic Congestion Index provides scores for cities in the United States, Canada, China, Australia, New Zealand, Europe, South Africa and Latin America. The INRIX Traffic Scorecard provides information on cities in the United States, Canada and Europe. The Castrol Magnatic Start-Stop Index provides by far the greatest geographical coverage, with data from the United States, Canada, China, Australia, New Zealand, Europe, South Africa, Latin America and Southeast Asia. However, over its larger geography, fewer cities are evaluated in this survey than in the Tom Tom and INRIX indexes.
The state of traffic congestion reporting is has improved and it seems likely that the remaining portions of the world not yet reported upon will soon be added.
Rating Starts and Stops
The Castrol Magnatic Start-Stop Index relies on data automatically collected from its subscribers by traffic index publisher and vehicle navigation company, Tom Tom. Castrol Magnatic rates each city on a "three color" matrix. Cities with an average of more than 18,000 starts and stops annually are rated "red." This indicates a "severe" level of start-stop driving. The second level is "amber," with annual starts and stops between 8000 and 18,000. This is considered "heavy" level of start-stop driving. The least critical level is "green," which indicates a "moderate" level of start-stop driving.
Megacities and Start-Stop Driving
Fourteen of the worlds 34 megacities were included in the Start-Stop Index. The Start-Stop Index provides the first information for Jakarta, which has often been cited anecdotally for the worst traffic congestion, a title is now bestowed by Castrol Magntic. Some, but not all of the megacities have been previously rated with high levels of traffic congestion in the other indexes.
Istanbul ranked second among the megacities with 32,520 starts and stops annually. This Istanbul was also second worst in the Tom Tom Congestion Index in 2013. Mexico City had 30,840 starts and stops annually. Mexico City was also among the most congested cities in the 2013 Tom Tom Congestion Index, ranking fifth.
Moscow was the fourth most congested megacity in the Start-Stop Index, with nearly 29,000. Last year, Tom Tom ranked Moscow as having the worst traffic congestion.
Like Jakarta, Bangkok has often been anecdotally cited for having the worst traffic congestion in the world. Traffic is bad in Bangkok, but ranks only fourth worst in the world in according to the Start-Stop Index, with approximately 27,500 stops and starts annually.
Buenos Aires had the six the worst traffic congestion at nearly 24,000 stops and starts annually. Shanghai was rated seventh among the megacities with approximately 23,000 starts and stops, but did not make Tom Tom's most congested 10.
São Paulo was the eighth ranked megacity in nearly a tie with Shanghai. Sao Paulo was ranked seventh by Tom Tom.
Beijing, London and Paris rounded out the 11 cities with severe start-stop driving levels ("red"), with at least 18,000. Beijing ranked as the ninth most congested megacity, the same as its Tom Tom ranking. London's was ranked 10th among the megacities, compared to its the current "London Commute Zone" ranking of third worst in the INRIX Traffic Scorecard. Paris was not ranked in the worst 10 by either INRIX or Tom Tom.
Three of the megacities had heavy start-stop driving levels ("amber"). Megacity Rio de Janeiro ranked 12th, compared to its third worst ranking by Tom Tom.
It may come as a surprise to harried commuters, but the two American megacities were ranked least congested. New York ranked 13th. By far the lowest number of annual starts and stops registered for a megacity were in Los Angeles, at approximately 9,400. This is more than 40% better than for New York and is less than one third of the annual starts and stops in Jakarta (Figure 1). Los Angeles is currently rated as having the fourth worst congestion by INRIX, following Honolulu, Milan and the London Commute Zone, though is not ranked in the worst 10 by Tom Tom. The least congested ranking among the megacities for Los Angeles is at considerable odds with the near domination worst rankings for the three decades of the Texas A&M Transportation Center Urban Mobility Report (which includes only US cities).

The Developing World and the New World
The developing world dominated the most congested rankings among all cities. Among the 10 most congested cities, only one high income city was included, Rome.
Most of the other cities of the New World (Canada, Australia and New Zealand) had fewer than 10,000 starts and stops per year. This included Toronto, Melbourne, Sydney, Auckland and Wellington. The exceptions were Vancouver and Sydney, both with approximately 13,000 starts and stops per year. A number of smaller cities (below 500,000 population) also had fewer than 10,000 starts and stops per year, such as Tampere, Finland and Brno in the Czech Republic.
Environmental and Economic Costs of High Density
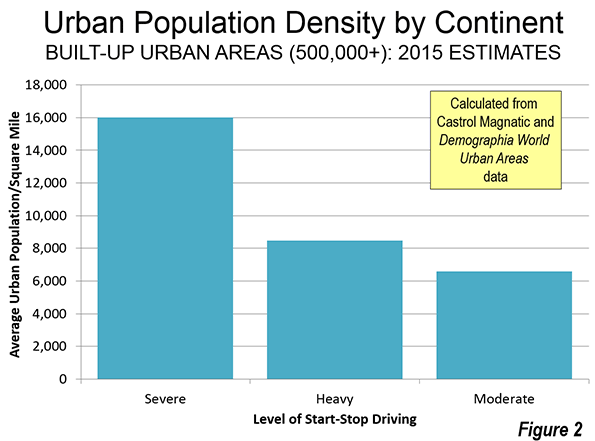
Generally, the worst start-stop congestion ratings are associated with cities that have higher urban population densities (Figure 2). This is consistent with the association of greater traffic congestion analysis with higher urban population densities, also found in the Tom Tom Traffic Congestion Index and the INRIX Traffic Scorecard.

More starts and stops impairs fuel economy, which also materially increases greenhouse gas emissions. Moreover, greater traffic congestion lengthens travel times. Economic growth is greater in where there is rapid mobility throughout the entire metropolitan area (labor market). Yet, urban plans often seek higher densities in their quest for reduced greenhouse gas emissions. The Castrol Magnatic Start-Stop Index results underscore the need for rational urban planning that takes into full account both the economic and environmental consequences of strategies that lead to greater traffic congestion.
Wendell Cox is principal of Demographia, an international public policy and demographics firm. He is co-author of the "Demographia International Housing Affordability Survey" and author of "Demographia World Urban Areas" and "War on the Dream: How Anti-Sprawl Policy Threatens the Quality of Life." He was appointed to three terms on the Los Angeles County Transportation Commission, where he served with the leading city and county leadership as the only non-elected member. He was appointed to the Amtrak Reform Council to fill the unexpired term of Governor Christine Todd Whitman and has served as a visiting professor at the Conservatoire National des Arts et Metiers, a national university in Paris.
Photo: Jakarta: low capacity main artery from busway station (by author)


I am glad to read it and
I am glad to read it and being able to reveal my ideas on it. I want to say that this article is amazing, great written and come with approximately all technology info. I'd like to read more posts like this!
thanks for sharing this! Datpiff Packages