Eurostat, the statistical agency of the European Commission (European Union) now designates metropolitan areas (Note) for the European Union (EU) and the European Three Trade Association (EFTA). The EU has 28 members, having just added Croatia, while the EFTA has 4 members. According to the latest data, there are 99 major metropolitan areas in Europe (those more than 1,000,000 residents). Overall, Eurostat designates 305 metropolitan areas with more than 200,000 population.
Europe’s Largest Metropolitan Areas
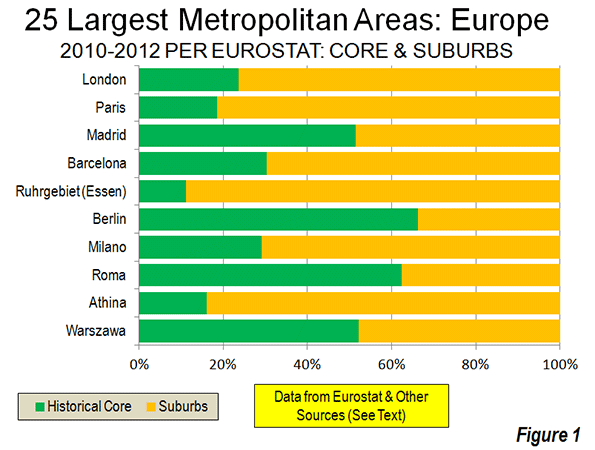
London and Paris are by far the largest metropolitan areas in Europe. London's population is approximately 13.6 million, of which approximately 24 percent live in the historical core of Inner London (the pre-1965 London County Council area). Paris has approximately 11.9 million residents, with 19 percent living in the historical core of the ville de Paris.
The third and fourth largest major metropolitan areas are both in Spain. Madrid has a population of 6.4 million, more than half of which is in the historic core municipality. Barcelona ranks fourth largest, with a population of 5.4 million, with 30 percent living in the historical urban core municipality. In recent decades there has been substantial suburbanization in the valleys to the north of the city of Barcelona. Moreover, the Eurostat Milan metropolitan area definition could be too tight. The urbanization stretches into Como, Lecco and Varese and an argument could be made for inclusion of exurban Lodi and Pavia. These would raise Milan’s population to nearly that of Madrid.
Germany has the other two metropolitan areas with more than 5 million residents, Essen (Ruhrgebiet or Rhine area) and Berlin. Both metropolitan areas have a population of 5.1 million. By some definitions, a Rhine-Ruhr metropolitan area would include Dusseldorf and even Cologne (Köln) and Bonn to the south. This wider area has a population of more than 11 million and would rank among the top three in Europe. Eurostat breaks this area into four metropolitan areas.
Overall, approximately 1/3 of the metropolitan population lives in the historical urban cores of Europe’s 99 major metropolitan areas, with approximately 2/3 of living in the suburbs and exurbs (Figure 1). This percentage is somewhat smaller among the metropolitan areas with more than 5,000,000 population (30 percent). The 25 largest metropolitan areas are shown in the table, and all 99 metropolitan areas are listed in Europe: Major Metropolitan Areas & Historic Core Populations: 2010 to 2012.

| European Metropolitan Areas as Designated by Eurostat: Largest 25 | ||||||
| European Union (EU) and European Free Trade Association (EFTA) | ||||||
| 2010-2012 Estimates, with Historical Core Estimates | ||||||
| Rank | Metropolitan Area | Nation | Metropolitan Area (Millions) | Year: Metropolitan Area Estimate | Historical Core: Recent Year (Millions) | Approximate % in Historical Core |
| 1 | London | UK | 13.614 | 2012 | 3.231 | 23.7% |
| 2 | Paris | France | 11.915 | 2012 | 2.204 | 18.5% |
| 3 | Madrid | Spain | 6.388 | 2012 | 3.284 | 51.4% |
| 4 | Barcelona | Spain | 5.357 | 2012 | 1.623 | 30.3% |
| 5 | Ruhrgebiet (Essen) | Germany | 5.135 | 2012 | 0.573 | 11.2% |
| 6 | Berlin | Germany | 5.098 | 2012 | 3.375 | 66.2% |
| 7 | Milano | Italy | 4.275 | 2012 | 1.242 | 29.1% |
| 8 | Roma | Italy | 4.234 | 2012 | 2.638 | 62.3% |
| 9 | Athina | Greece | 4.109 | 2012 | 0.664 | 16.2% |
| 10 | Warszawa | Poland | 3.272 | 2012 | 1.708 | 52.2% |
| 11 | Hamburg | Germany | 3.228 | 2012 | 1.734 | 53.7% |
| 12 | Napoli | Italy | 3.078 | 2012 | 0.959 | 31.2% |
| 13 | Budapest | Hungary | 2.985 | 2012 | 1.741 | 58.3% |
| 14 | Brussels | Belgium | 2.923 | 2012 | 0.166 | 5.7% |
| 15 | Lisboa | Portugal | 2.824 | 2012 | 0.548 | 19.4% |
| 16 | Katowice | Poland | 2.795 | 2012 | 0.308 | 11.0% |
| 17 | München | Germany | 2.727 | 2012 | 1.388 | 50.9% |
| 18 | Stuttgart | Germany | 2.692 | 2012 | 0.613 | 22.8% |
| 19 | Manchester | UK | 2.683 | 2012 | 0.503 | 18.8% |
| 20 | Wien | Austria | 2.636 | 2012 | 1.731 | 65.7% |
| 21 | Lille - Dunkerque | France-Belgium | 2.584 | 2012 | 0.227 | 8.8% |
| 22 | Frankfurt am Main | Germany | 2.575 | 2012 | 0.692 | 26.9% |
| 23 | Praha | Czech Republic | 2.521 | 2012 | 1.291 | 51.2% |
| 24 | Valencia | Spain | 2.513 | 2012 | 0.809 | 32.2% |
| BY SIZE CATEGORY | ||||||
| Over 5,000,000 (6) | 47.507 | 14.290 | 30.1% | |||
| 2,500,000 to 5,000,000 (18) | 54.653 | 18.962 | 34.7% | |||
| 1,000,000 to 2,500,000 (75) | 104.376 | 35.176 | 33.7% | |||
| Total | 206.536 | 68.428 | 33.1% | |||
| Notes: | ||||||
| Metropolitan area estimates from Eurostat | ||||||
| Core estimates from multiple sources and is for 2008 or later | ||||||
| Historical Core: The smallest area corresponding or including the pre-automobile core for which data is readily available. In each case the historical core is the first named municipality (commune), except in London (where Inner London is used) and Antwerp (where the pre-1983 consolidation municipality is used). | ||||||
Enlargement Nations Compared to the EU-15 and EFTA
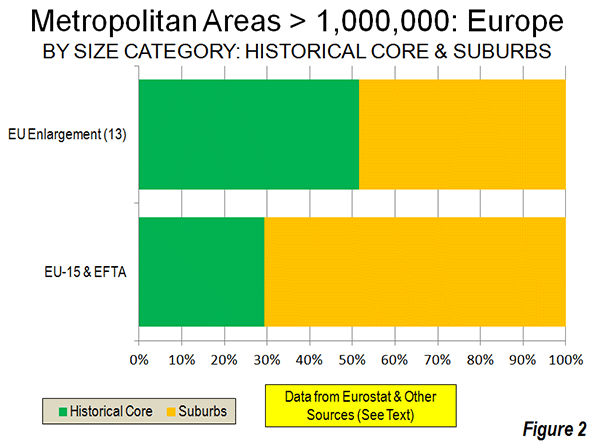
The share of the population living in the historical urban cores is much higher in the generally less affluent nations that have been added to the European Union over the last decade. In the 13 enlargement nations, approximately 52 percent of the metropolitan area population lives in the historical urban core. By contrast, in the more affluent nations of the EU – 15 and the EFTA only 29 percent of the major metropolitan area population lives in the historical urban cores (Figure 2).

To some degree, this difference is explained by the stronger central planning in metropolitan areas that developed in the more controlled economies in the enlargement nations before the fall of the Soviet Union. Planners were usually given larger geographical areas to control than has typically been the case in Western Europe, North America and Japan. The metropolitan areas of the enlargement nations also have substantially more dense principal urban areas, averaging 11,300 per square mile (4,300 per square kilometer), compared to 8,400 per square mile (3,200 per square kilometer) in the EU-15 and the EFTA.
Resurgence of the Historical Cores
Western Europe’s historical cores experienced substantial population losses in the decades leading to 2000. This trend, similar to that in the United States, saw the population of Inner London drop 55 percent from its 1911 peak to its 1991 low. The ville de Paris lost more than one quarter of its population from 1921, a rate slightly greater than in the city of Chicago over the same years. Copenhagen lost 35 percent of its population. In the decades from the mid 20th century to 2000, virtually every major urban core municipality in Western Europe declined from its peak population, except for those that expanded their boundaries, combined with another municipality or had substantial greenfield space for suburban development within their city limits (such as Rome).
Since 2000, as we see in the United States, many of the historical cores have begun adding population. Much of the increase has resulted from the international migration that has been spurred by the open borders of the EU's enlargement (See: Examining Sprawl in Europe and America: Europeans are Moving to the Suburbs Too). Inner London has been a particular beneficiary of this trend, adding nearly 900,000 residents over the last two decades. Much of this gain is from international migration, as Inner London suffered a minus 1.5 percent annual domestic migration rate in the 2000s, less than that of New York City (1.8 percent), but more than that of Los Angeles County (1.4 percent). Inner London’s population remains 36 percent below its peak level of more than a century ago.
Comparisons to the United States
Europe has nearly twice as many major metropolitan areas as the United States. The total major metropolitan area population is also higher, at 207 million compared to 173 million in the United States. Yet the major metropolitan areas of the United States constitute a larger share of the urban population. Approximately 55 percent of the US population lives in a major metropolitan area, compared to only 40 percent in Europe. The share of major metropolitan areas in the historical urban cores is slightly higher in Europe, at 33 percent, compared to 27 percent in the United States.
Growing Metropolitan Areas
International migration, particularly from the enlarged EU, as well as the continuing shift from rural to urban areas has driven stronger growth throughout some metropolitan areas. Eurostat metropolitan area data is available from as early as 2003 and shows Madrid to be the fastest growing, at a 1.5 percent annual rate. Rome is not far behind, with a 1.4 percent annual rate. Brussels is growing at a 1.1 percent rate, while London, Prague and Valencia are adding 1.0 percent to their populations each year. While detailed Eurostat data is not available for earlier years in Milan, strong growth has been indicated. Even formerly moribund Vienna, which reached its population peak early in the 20th century, is growing at an unprecedented 0.8 percent annual rate.
Other major metropolitan areas continue with slow growth or are even declining. Europe's two largest conurbations, Essen and Katowice (the Upper Silesian metropolitan area of Poland) are losing population. Naples is simply not growing.
Before beginning its metropolitan area estimation system, Eurostat designated similar areas as “larger urban zones.” This system continues, with considerable comparative information between areas. However, data is issued less frequently. Eurostat’s metropolitan area system, with its annual estimates and more consistent definitions is an important step forward.
Wendell Cox is a Visiting Professor, Conservatoire National des Arts et Metiers, Paris and the author of “War on the Dream: How Anti-Sprawl Policy Threatens the Quality of Life.
Note: Metropolitan areas are labor markets and always include both a principal urban area (contiguously built up area) and connected rural territory. Smaller urban areas may also be included. See: Definition of Terms used in The Evolving Urban Formseries.
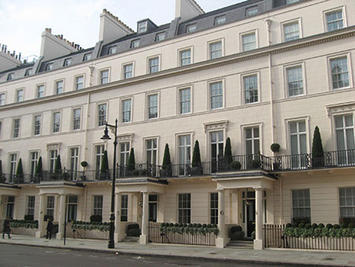
Photo: Belgravia, London (by author)


Cool Find! It's good to get
Cool Find! It's good to get some coffee today and post some comments here more often.
harga ban corsa
The ratio of areas with
The ratio of areas with growth decline is alarming. I dont want to imagine these areas as dead development zones. Airport Car Parking UK
http://www.swiftairportparkin
http://www.swiftairportparking.co.uk/
Advanced transportation is the need for hour for populated countries. People prefer to use local transport if it is cheap , safe and fast track. luton airport meet and greet is the best example of it as majority of people use it while traveling.
I high appreciate this post.
I high appreciate this post. It’s hard to find the good from the bad sometimes, but I think you’ve nailed it! would you mind updating your blog with more information?
will it work
What a good blog you have
What a good blog you have here. Please update it more often. This topics is my interest. Thank you. . .
http://unlockherlegsdownload.com
This is really a nice and
This is really a nice and informative, containing all information and also has a great impact on the new technology. Thanks for sharing it
girlfriend activation free
It is imperative that we
It is imperative that we read blog post very carefully. I am already done it and find that this post is really amazing.
how to get a very hot girl to like you
Thanks for writing such a
Thanks for writing such a good article, I stumbled onto your blog and read a few post. I like your style of writing...
Nightlife in Beijing
The website is looking bit
The website is looking bit flashy and it catches the visitors eyes. Design is pretty simple and a good user friendly interface.
should i buy the girlfriend activation system
That is really nice to hear.
That is really nice to hear. thank you for the update and good luck.
michael fiore text your ex back