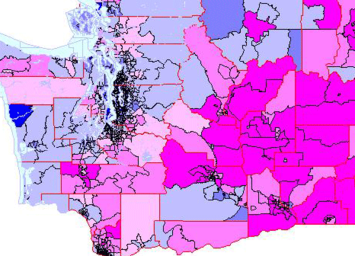
Washington may be a left coast “blue” state, but the geography of the voting well illustrates the national phenomena of intensifying polarization. The division may be among individual people, but also expressed in geographies down to precincts and census tracts.
The Washington 2012 elections provided ample data to assess this political and geographic divide. I review here the two most polarized races, for president (Obama vs. Romney) and for R74, to reaffirm the right to same sex marriage.
Here are a series of 6 maps, 3 for the presidential race, for the state as a whole, and for the greater Seattle area, and one showing just the extreme tracts for Obama in the Seattle area, and 3 for the R74 contest, for the state, for greater Seattle and again of just the extreme tracts, all in the city of Seattle. These maps illustrate the extreme dimensions of polarization impacting the regions.
The results suggest three overlapping dimensions. The dominant one is itself ecological – that is the urban-rural, or better large dense metropolitan territory versus rural, small towns, with smaller cities and metropolitan suburbs in between, and less polarized geographically. The strongest correlations in demographic variables are transit use vs. SOV use, density, single persons, and multi-family versus mobile homes.
These factors apply to both the Obama race and for R74, but more strongly for Obama. The second dimension is of social liberalism, and is characterized by variables on household relationships, unmarried partners, gay and lesbian, education, e.g., share with BA vs. with high school only, occupation, e.g., percent managerial professional vs. percent in laboring and construction occupations. The social divide also shows difference by age, those 20-34 more liberal, areas with high shares under 18, that is families, more conservative. This dimension too applies to both contests, but more strongly to R74. The third dimension is race, minority racial areas vs. more white areas, and positively correlated with support for Obama, although the Asian share is much more related to support for R74. In Washington we will see that the racial dimension really is somewhat distinct from the urban-rural, as Obama did well, but R 74 did poorly in rural small town areas that are now heavily minority (Hispanic and Native American).
In a few cases with a large difference should be noted. Areas dominantly white are non-supportive of Obama, but not opposed to R74. Similarly, areas high in managerial-professional occupations and higher education generally are more correlated with support for R74, than for Obama.
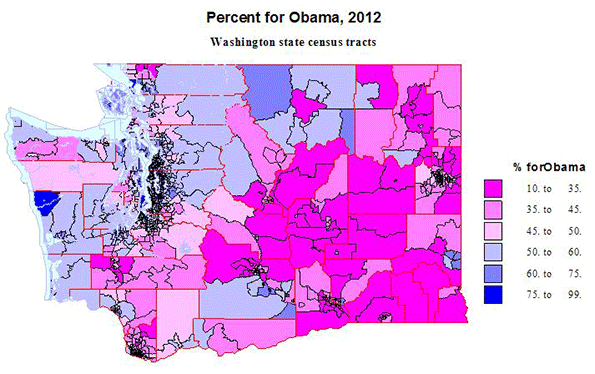
Obama carried Washington state by 464,000 votes, 56 to 44 percent, and R74 won by some 229000 votes, 54 to 46 percent. Consider first the maps for Washington State as a whole, realizing that like the US as a whole, rural territory dominates most of the physical space. I use the same intervals for mapping, so comparison is easier. The main difference between the Obama and R74 maps is race and ethnicity – many of the lighter blue rural small town areas are Native American Indian reservations, or strongly Latino areas, which voted for Obama, but also cast ballots overwhelmingly against R74, likely reflecting the role of local churches. Obama also did better than R74 in traditional logging areas of western Washington, a continuation of a long history of their identification with Democratic voting, but more conservative on the social issues like same sex marriage.
Rural to smaller city areas voting for both Obama and R74 include university towns, notably Pullman (Washington State in eastern Washington, Bellingham (Western Washington U), Olympia, the state capitol, and many areas of “spillover” of more educated and professionals, out of the Seattle core to desirable water and mountain environments, for retirement and second homes, At the other extreme are two areas in western Washington which are extremely “red” , the Centralia area in southwestern Washington, and the city of Lynden, up at the border with Canada, and still dominated by its Dutch Reformed church adherents.
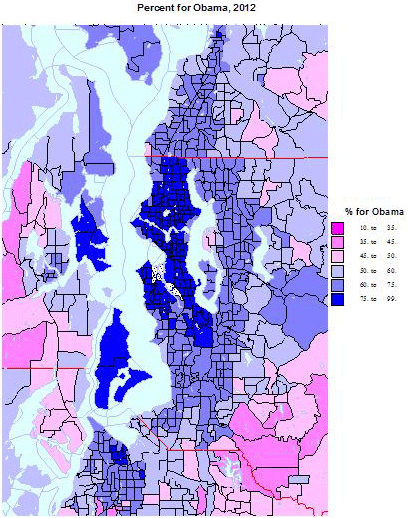
Turning to the equivalent maps for Obama and R 74 for the greater Seattle area, with two-thirds of the state population, the picture is broadly the opposite of that for the state. Here blue dominates, with “red” areas pushed to the rural edge. But the differences in the maps are interesting, illustrating the dimensions of polarization. The Obama map exhibits a simpler belted pattern, the dense urban core, the city of Seattle with spillover north and south, with an inner suburban belt of moderate Obama domination (60 to 75 percent) and an outer suburban and exurban ring. This pattern was repeated for the city of Tacoma to the south. To the west, however, are two islands of very high Obama support, Vashon and Bainbridge, with very high proportions of professionals commuting to the Seattle core. Areas of support for Romney include a few fairly close in affluent areas and more rural areas, including actual farming areas to the southeast.
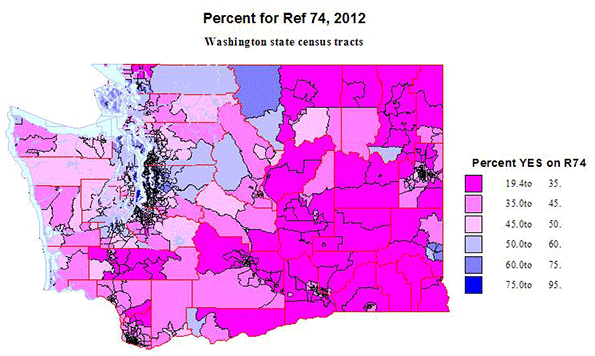
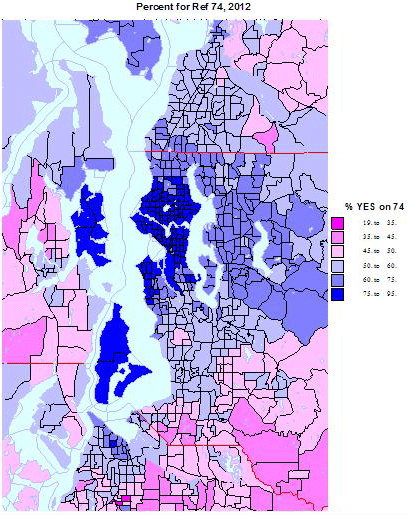
The map for R74 is subtly different. The area of strongest support is reduced to the city of Seattle, plus the commuter islands, but support for R74 is quite a bit weaker in less affluent and educated black and latino areas. Likewise the majority of inner suburban areas are still supportive for Obama but far less than the core. These are mainly family areas, while the areas of highest support in the city are dominated by singles and childless couples, including unmarried partners.
Conversely, moderately higher support for Obama and R74 extends somewhat farther east to affluent educated suburbs, e.g, the Microsoft workshed, which is also high in Asian population. The final two maps are of the tracts with the highest support for Obama and for R74, most of which are confined to the city of Seattle. The areas of over 90 % support are two: the historic CD or Central District, which defined the Seattle Black population as of 1970-1980, not much gentrified at the north end, but also including the core of Seattle’s GLBT community (the westward extension over 90 %. The second area is in near north Seattle, extending from west of the University of Washington westward in areas dominated by young singles and unmarried couples, including many students. The map for R74 is quite different, with no areas of extreme support to the south of the core GLBT area, but with stronger support than for Obama in the highly affluent and professional areas, just north of the GLBT core.
Clearly the 3 dimensions of polarization, by settlement type, by social values-education, and by race, all are exemplified by the map results. The geographic concentration of the vote, especially for R74 can be seen in these amazing numbers:
| Vote Results in Washington State | |||||
| State | State Outside King Co. | King Co | Seattle | King Co. Outside Seattle | |
| Obama | 1,755 | 1,087 | 668 | 279 | 389 |
| Romney | 1,291 | 1,015 | 276 | 46 | 230 |
| Difference | 464 | 72 | 392 | 233 | 159 |
| R74 yes | 1,660 | 1,021 | 639 | 274 | 365 |
| R74 no | 1,431 | 1,107 | 315 | 57 | 258 |
| Difference | 229 | -86 | 324 | 217 | 107 |
Obama carried the state by 464,000. Half of this was accounted for by just the city of Seattle. The
Pro vote for R74 was even more concentrated in the metropolitan core, as the margin just in the central city of Seattle , 217,000, was essentially the margin for the state! King County outside Seattle provided an additional margin of 107,000, offsetting a net loss of 86,000 in the entire rest of the state, where the vote was 1,107,000 to 1,021,000 against.
It is similarly amazing to note the relative location of areas with very high or very low vote shares for Obama and for R74. Eighty-nine census tracts were carried by Obama with over 85% of the vote and 83 tracts voted more than 83 percent for R74. The distributions were:
| Number of Census Tracts Voting 85% for Obama or 83% for Measure R74 | ||
| Obama | R74 | |
| North Seattle | 37 | 33 |
| Central Seattle | 19 | 26 |
| South Seattle | 26 | 1 |
| Pierce (Tacoma, reservation) | 1 | |
| Whatcom (WWU) | 2 | 2 |
| Whitman (WSU) | 2 | 1 |
| Yakima (Reservations) | 3 | |
| Thurston (Olympia) | 1 | |
Eighty-two of 89 of tracts with high Obama shares were in the city of Seattle, dominating the city and well distributed across it. The other 7 were in Tacoma, Olympia, Whatcom and Whitman, both university communities, and in Yakima county Indian reservations. All these tracts were urban core tracts, except for those on the Yakama reservation. Sixty of 63 tracts with the highest shares for R74 were in the city of Seattle, concentrated in the north (University of Washington dominated) or highly professional, and in the center, home of the large GLBT community, with few in the south of the city, which is less affluent and higher in minorities. The remaining 3 are in Whatcom (WWU) and Whitman (WSU). All these tracts are urban.
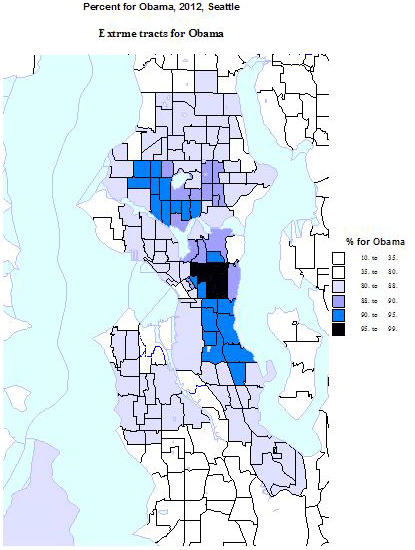
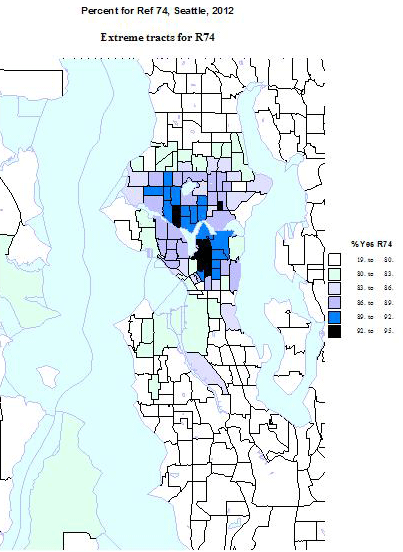
The distribution of tracts with very low shares for Obama and for R74 shows the other side of the polarization. Of the 71 tracts where Obama received less than a third of the vote, 34 were in south central Washington, the region of the Tri Cities of Richland, Kennewick and Pasco, Yakima, county and Grant county, home of the Columbia basin irrigation project, all areas high in Mormon and Latino populations. Another 19 were in north central and northeastern Washington, including much of Okanogan and Lincoln counties, and even some exurban counties around Spokane. Another 8 were in southeastern Washington (wheat country), leaving 9 in western Washington. Three each were in rural parts of Clark County and Lewis County in the southwest, and 3 were in the very conservative small city of Lynden, on the Canadian border, and home of a large Dutch reformed community. All these tracts are rural except for the city of Lynden and 3 suburban tracts in the Tri-Cities.
Similarly, of 81 tracts with shares below one third for R74, 32 were again in south central Washington, 21 in north central and northeastern Washington, 4 in the southeast, and now a larger 15 in western Washington. The Lynden area of Whatcom county accounts for 4, but now 6 in socially conservative Lewis County, 4 in rural parts of Clark County, and 2 in family dominated military parts of Pierce County. All these tracts are rural, small town, except for those in Lynden, again in suburban Tri-cities and 2 in suburban Tacoma.
Differences between Obama and R74 Shares
The last discussion compares the vote for Obama and for R74, identifying areas with the greatest difference, recalling that the overall correlation was a very high .87. Please also see Map 7.
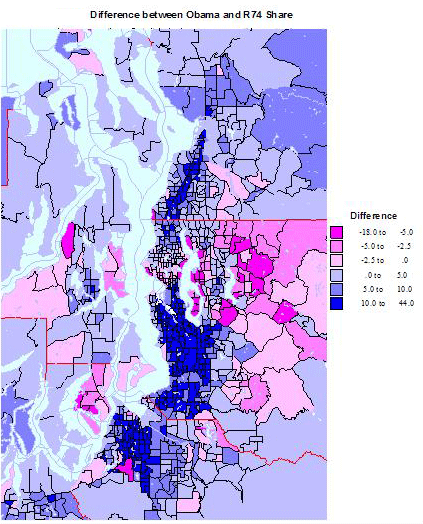
The Obama vote exceeded the share for R74 by more than 20 percent in 56 census tracts.
In rural areas Obama did well with the large Latino vote, which also voted against R74. This was true as well in Indian reservation tracts. In Seattle and Tacoma the tracts are mainly lower to middle class, worker areas, Black or Latino or both. All of the King county tracts were in south Seattle, extending southward into lower and middle class industrial suburbs.
The R74 vote exceeded the Obama vote by 5% or more in 51 tracts.
Overall, R74 fared better than Obama in affluent professional areas, socially more liberal but economically more conservative. But the pattern surprisingly occurs in several military base areas, as in Island and Kitsap counties. In 15 tracts R74 won but Obama lost, all affluent suburb or military areas in several parts of the state. In King the 4 tracts are the 2 richest tracts in the state plus 2 near the Microsoft Redmond campus. In 12 tracts both Obama and R74 won, but R74 polled higher. These tracts were spread across the state, in mainly exurban economically conservative areas. In 24 tracts Obama and R74 won. All but one were in King, most in the professional suburbs east of Seattle and a few in the wealthiest tracts inside the city of Seattle.
Conclusion
The electorate of Washington, like that of the country, is ideologically divided, and which is manifest geographically in the familiar red and blue mosaics. Washington overall is on the economically and socially liberal side, although statewide maps would not recognize the degree of this, simply because of the extreme concentration of these sub-populations in the urban cores, and especially in and around the city of Seattle.
Richard Morrill is Professor Emeritus of Geography and Environmental Studies, University of Washington. His research interests include: political geography (voting behavior, redistricting, local governance), population/demography/settlement/migration, urban geography and planning, urban transportation (i.e., old fashioned generalist).


There are many forums on
There are many forums on help me save my marriage but only the associates can preserve their weddings by knowing each other, by improving the emotions.
Washington may be a left
Washington may be a left coast “blue” state, but the geography of the voting well illustrates the national phenomena of intensifying polarization. The division may be among individual people, but also expressed watch bleach in geographies down to precincts and census tracts.
The Washington 2012 elections provided ample data to assess this political and geographic divide. I review here the two most polarized races, for president (Obama Noblesse manga comics vs. Romney) and for R74, to reaffirm the
Washington Red Data Girl
Washington Red Data Girl may be a left coast “blue” state, but the geography of the voting well illustrates the national phenomena of intensifying polarization. The division may be among individual people, but read Shingeki no Kyojin manga also expressed in geographies down to precincts and census tracts.
The Washington 2012 elections provided ample data to assess this political and geographic divide. I review here the two most polarized races, for president (Obama vs. Romney) and for R74, to reaffirm the
Conclusion
The electorate of Washington, like that of the country, is ideologically divided, and klima servisi which is manifest geographically in the familiar red and blue mosaics. Washington overall is on the economically and arçelik klima servisi socially liberal side, although statewide maps would not recognize the degree of this, vestel klima servisi simply because of the extreme concentration of these sub-populations in the urban cores, and especially in and around the city of Seattle.
Another 19 were in north central and northeastern Washington, including much webmaster forumları of Okanogan and webmaster forumu Lincoln counties, and even some exurban counties around Spokane. Another 8 were in southeastern vaillant kombi servisi Washington (wheat country), leaving 9 in western Washington. Three each were demirdöküm kombi servisi in rural parts of Clark County and Lewis County in the southwest, and 3 were in the very conservative small city of Lynden, on the Canadian border, and home of a large Dutch reformed baymak kombi servisi community. All these tracts are rural except for the city of Lynden and 3 suburban tracts in the Tri-Cities.