Population change has short run and long run effects. Short run effects include changes in fertility rates that can result from economic fluctuations. For example, during a recession, couples may delay having children until economic conditions improve. Once job growth has begun and expectations rise, birthrates can increase The correlation is not perfect and other demographic factors could come into play.
Yet it seems increasingly true that for a rapidly increasing portion of the American landscape, deaths will routinely exceed births. Indeed, total births in the USA peaked at 4,316,000 in 2007, before dropping in the last four years. Recently released provisional birth data by the CDC (Center for Disease Control) show that births in 2011 are preliminarily estimated to be 3,961,000, the lowest figure since 1999. Reviewing the data month by month, we seem to be experiencing continued downward momentum this year. With deaths hitting an all time high of 2,507,000 in 2011, the natural rate of increase for 2011 looks to have dropped to .0047 percent (slightly less than half a percent per year).
With the expectation that the world’s population will stabilize mid-century, eventually every country’s population – with few exceptions in Africa and elsewhere – will stop increasing. Deaths will exceed births in most countries, and future growth may become more a function of shifting migration patterns.
This reality can already be seen in parts of the United States. In one third of the 3,141 counties deaths now exceed births. In the next nine years, the number of counties in this category will expand, which could result in a markedly lower population count in the 2020 census. In contrast, a number of counties continue to experience significant natural rate of increase, and a handful of places experience the triad of dynamic change: births exceeding deaths, immigration, and positive net migration from other parts of the USA.
The Census recently released population estimates for America’s 3,141 counties. We can compare the estimates of July 1, 2011 with those of July 1, 2010, by visualizing a series of maps.
Map Figure One: Estimated Population by County as of July 1, 2011
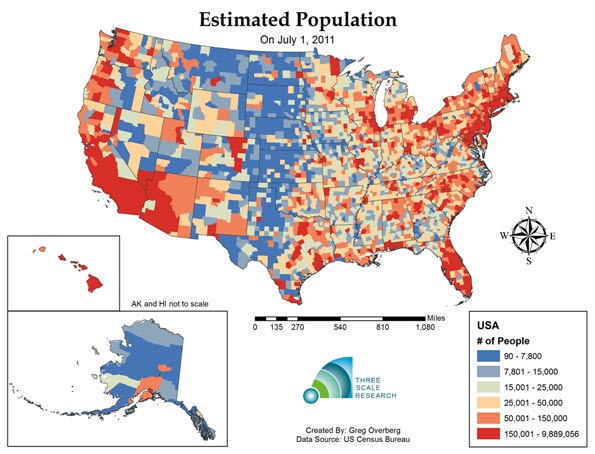
The first map shows the distribution of population by county: revealing concentrations in the coastal areas, and lower population in the central regions. Los Angeles County, California had the most persons:9,889,056 persons; Kalawao County, Hawaii had the fewest: 90 persons.
Map Figure Two: Estimated Absolute Change in Population from July 1, 2010 to July 1, 2011
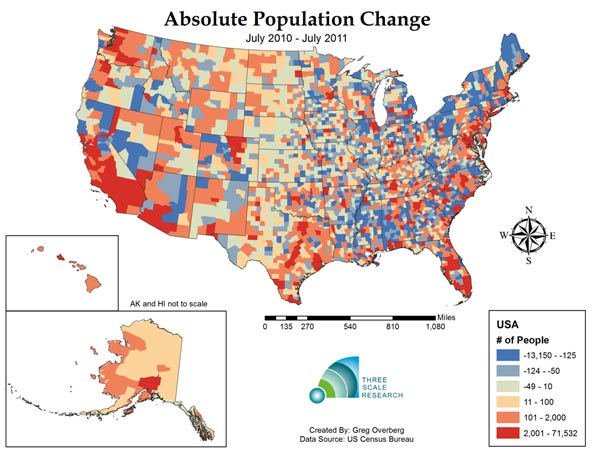
The second map shows the pattern of population change during one year. A total of 1,494 counties lost population, or about 47% of America’s 3,143 counties. This number is an increase from the change from 2000-2010, where 1,103 counties lost population. As one third of counties are experiencing greater deaths than births, another twelve percent are experiencing losses due to net migration. The county that gained the most people from 2010 to 2011 was Harris County, Texas (Houston), which added 71,532 persons. The county that lost the most people was Wayne County, Michigan (Detroit), with a decline of 13,150 persons.
Map Figure Three: Estimated Relative Change in Population from July 1, 2010 to July 1, 2011
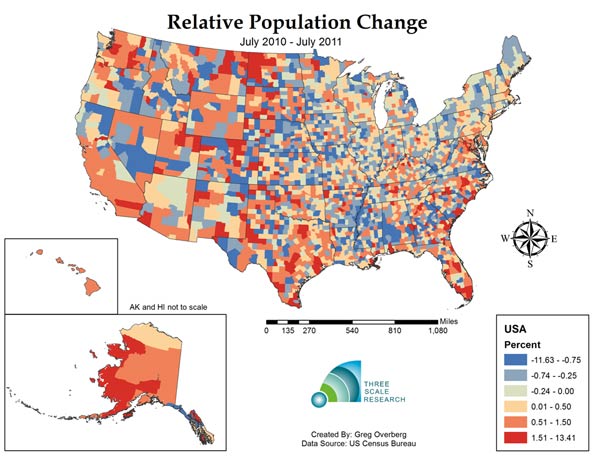
The third map shows relative population change in the United States. This reveals quite a varied landscape. Western North Dakota, experiencing rapid growth of its energy sector, is experiencing fast population growth, along with metropolitan counties in Texas, Colorado, North Carolina and Florida. The county with the fastest population growth is Loving County, Texas, in the rural and isolated West Texas panhandle, with a 13.25% growth rate resulting from the population increasing from 83 to 94 persons. The county with the fastest shrinking population is Roberts County, Texas, in the equally rural and isolated North Texas panhandle with a decline of -11.69%. Counties with very small populations can be subject to rapid change due to the effects of migration.
Map Figure Four: Estimated Relative Births minus Deaths (Natural Rate of Absolute Population Change) from July 1, 2010 to July 1, 2011
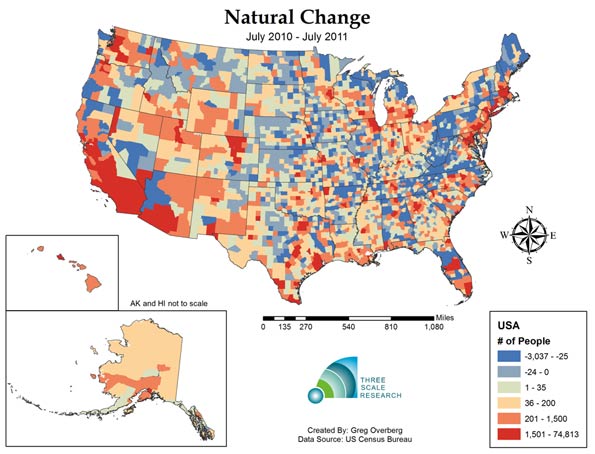
The fourth map shows the landscape of births minus deaths, or natural change, without the effects of migration. In 2011, one third of counties, or 1,041 out of 3,143 have deaths exceeding births. At the same time, counties with positive natural change, or births exceeding deaths, are concentrated, with half of all net natural change occurring in only 61 counties. The county with the highest level of natural change is Los Angeles County, with a 74,813 natural increase. The county with the highest negative level is Pinellas, Florida (Tampa- St. Petersburg area), with a decrease of 3,037 persons.
Map Figure Five: Estimated Relative Births minus Deaths (Natural Rate of Relative Population Growth) from July 1, 2010 to July 1, 2011
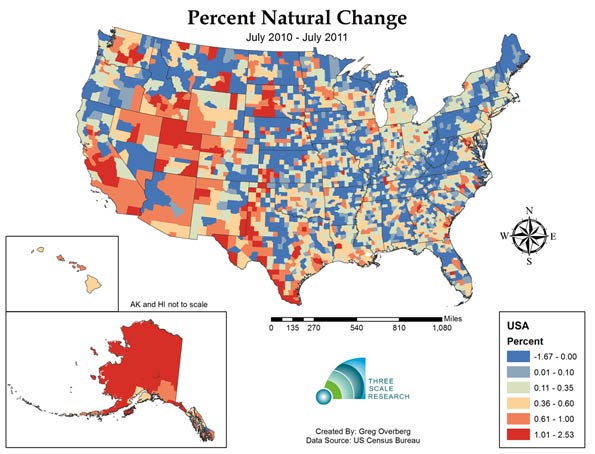
The fifth map show relative natural rate of population change, and the extensive area of slow and negative natural population decrease. Most of the Appalachian counties have deaths exceeding births, along with extensive areas in the Great Plains states and at least parts of all 48 lower states. Only Alaska and Hawaii have positive natural increase across all of their respective counties. The fastest growing natural population is in Northwest Arctic Borough, Alaska, growing at a rapid 2.53% per year.
Despite this expansive landscape of 1,041 counties that now have deaths exceeding births, and hundreds of counties approaching this status, there are 162 counties that exceed 1% growth per year, or are growing at about the global average rate. On the other hand, only 11 counties are declining faster than 1% a year, indicating that most of the impact is gradual.
Map Figure Six: Estimated Domestic Migration from July 1, 2010 to July 1, 2011
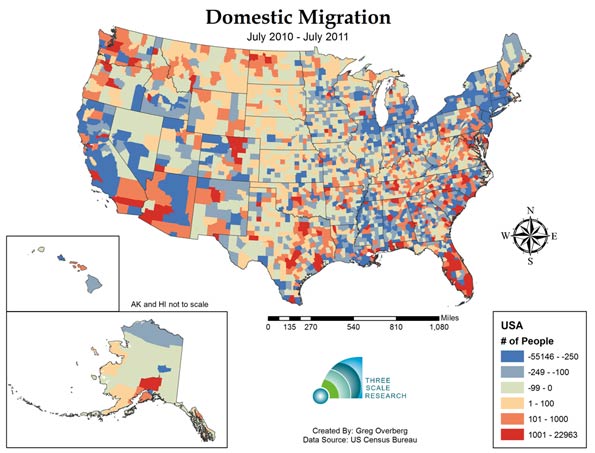
The sixth map shows domestic migration, or net moves from one county to another. The top 159 counties received a net of 1,000 domestic migrants or more, and these areas include Florida, the Front Range Counties of Colorado, and the major metropolitan counties of Texas. Overall, 1,229 counties had positive domestic migration, while 1,914 counties had negative domestic migration. Hillsborough, Florida (Tampa area), had the highest positive migration with 22,963 net movers, while Los Angeles County, California had the greatest number of net leavers with a total of 55,146 net departing residents.
Map Figure Seven: Estimated International Migration from July 1, 2010 to July 1, 2011
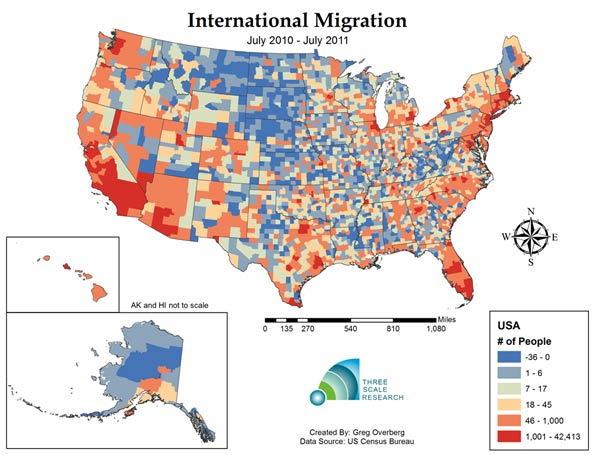
The seventh map shows the coastal pattern of international migration. International migration is most visible in California, Arizona and Nevada, and in a number of metropolitan areas including the Northeast and the Chicago area. One-hundred and thirty- two counties experienced more than 1,000 immigrant arrivals, and these counties received 74 percent of immigrants, indicating that immigration is concentrated. On the other hand, immigration is also widespread, as all but 520 counties received one or more immigrants during the year.
The top county for international immigration was Los Angeles, California, with a total of 42,413 immigrants. The next four counties were Miami-Dade, Florida, with 19,996; Harris, Texas (Houston), with 19,558, Cook, Illinois (Chicago) with 17,208 and Queens, New York with 15,949 immigrants.
Map Figure Eight: Estimated Net Migration (Combined International and Domestic) from July 1, 2010 to July 1, 2011
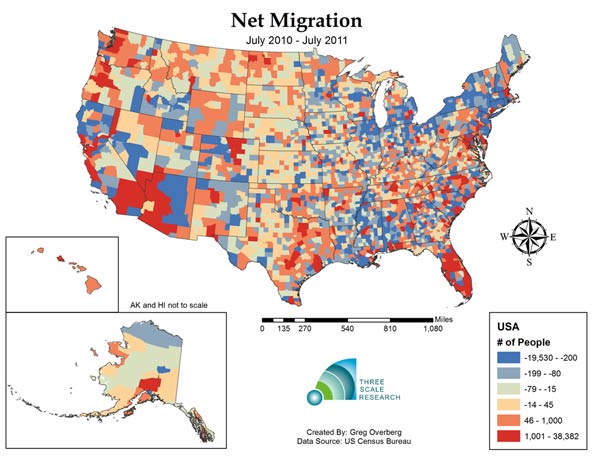
The eighth and final map shows the combined effect of domestic and international migration. Net migration is positive in areas of the Southwest, Texas metropolitan areas and most of Florida. A total of 1,403 counties had positive net migration, while 1,740 counties experienced negative net migration. The top county in America for positive net migration was Miami-Dade county in Florida, with a net migration of 38,382 persons. The county with the highest negative net migration was Wayne County, Michigan, with a net migration rate of -19,580 persons.
Today one third of United States Counties appear to have entered the stage of zero population and perhaps even negative population growth, but only 31.4 million people or ten percent of the American population lives in these mostly rural counties. Given our concentration in metropolitan areas, the expansion to an ever larger group of counties might continue all the way up to about eightly percent of our land area, before the momentum of this effect manifests into the major population clusters. Fertility rates by race and Hispanic origin of the mother may play a role, but it should be noted that the Hispanic fertility rate has dropped from 2.53 in 2009 to 2.35 in 2010, and may have further declined in 2011. The impact of reduced immigration might also play a role in depressing population growth.
The first estimate of county population change, the period from July 1, 2010 to July 1, 2011, shows a mixed picture of dynamic activity; there are a set of counties still experiencing robust population growth, but a third and perhaps increasing number of counties undergoing negative natural population growth. These changes can be compared with 2012 county estimates in a year from now, and we can look for the diffusion process associated with population slowdown to continue. We will update our maps as further information becomes available.
Ron McChesney is a Geographer with Three Scale Strategy and Research in Columbus, Ohio. Ron received a PhD in Geography at The Ohio State University in 2008.
Greg Overberg is a City and Regional Planner with Three Scale Strategy and Research in Columbus Ohio. Greg received a MA in City and Regional Planning at The Ohio State University in 2011.
Sources:
Centers for Disease Control (CDC), 2012: Provisional monthly and 12-month ending number of live
births, deaths, and infant deaths and rates: United States, January 2010 – December 2011. Provisional
data from the National Vital Statistics System, National Center for Health Statistics.
Statistical Abstact of the United States, 2011. Table 78. Live Births, Deaths, Marriages and Divorces.
US Census Bureau, 2011 County Total Population Estimates:
Web Site: http://www.census.gov/popest/
Accessed April 30, 2012
US Census Bureau, 2000 and 2010 Census by County:
Web Site: http://www.census.gov/popest/data/intercensal/county/county2010.html
Accessed April 30, 2012


Visual representation - misleading
Your visual representation of the data point for each county is proportional to geographic area of the county - but your data is not.
Good effort. Try again.
...mike
Math Problem
At the bottom of paragraph two:
"the natural rate of increase for 2011 looks to have dropped to .0047 percent (slightly less than half a percent per year)."
Based on the remainder of the article, it appears that the correct figure should be 0.47 percent, instead of the figure cited.
Otherwise, interesting data!
The latest data from the
The latest data from the Bureau of the Census indicates that the home ownership
writing a research paper
A question on the natural increase issue
Given that a lot of small counties don't have local ob/gyn services how many births are recorded in larger counties with hospital facilities. For example take Kimble county Texas with a population of 4600, and 57 deaths and 56 births. While it has a hospital with the modern trends how many go to hospitals in San Angelo or San Antonio for births?