Analysis of the state of the world’s cities 2010/2011 by UN-Habitat focused on the narrowing urban divide, with 227 million people moving out of slum conditions over the preceding decade. While acknowledging uncertainty over cause and effect, the report notes that:
urbanization ... is associated in some places with numerous, positive outcomes such as technological innovation, forms of creativity, economic progress, higher standards of living, enhanced democratic accountability and women’s empowerment. ... the report calls for policy-makers and planners to understand that urbanization can be a positive force for economic development, leading to desirable social and political outcomes.
The North Atlantic solution
The report acknowledges the diversity of urbanisation[1], making its authors' somewhat singular approach to managing it (more density) incongruous. Their prescription is based on resisting urban sprawl, reflecting the experience of North America. They also suggest that sprawl is a sign of “divided cities”, translating into
an increase in the cost of transport, public infrastructure and of residential and commercial development. Moreover, sprawling metropolitan areas require more energy, metal, concrete and asphalt than do compact cities because homes, offices and utilities are set farther apart.
The report denounces sprawl in suburban zones of high and middle income groups and in extensive slums on the city edge. On the latter, they invoke issues of governance, saying it occurs because
authorities pay little attention to slums, land, services and transport. Authorities lack the ability to predict urban growth and, as a result, fail to provide land for the urbanizing poor.
Can one size fit all?
It is difficult to accept prescription predisposed to a particular view. Urbanisation is not a single condition. Differences in the stage of urbanisation, vastly different physical, cultural and economic settings of “urban” settlement, and different institutional arrangements belie the idea of a universal response or that any particular form is best for all cities.
Apart from anything else, “western” cities [2] don’t really feature in 21st century urbanism. Consider the figures. In 1950 western cities accounted for 43% of the world’s urban population. This was down to 23% in 1990 and 18% in 2010. UN projections have the figure down to 15% in 2030, accounting for between just 3% and 4% of all urban growth between now and then.
What Size City?
This post looks at some more numbers that help illustrate the diversity of urbanisation – the size of urban settlements.
According to UN figures, 8% of the world’s population lives in 53 cities housing over 5 million people; 12% in 388 cities of between 1 and 5 million; and 31% in cities of under 1 million. Any prescriptions for urban governance and urban form need to reflect quite extreme divergence between the few megacities and the many smaller settlements where the majority of urbanites live.
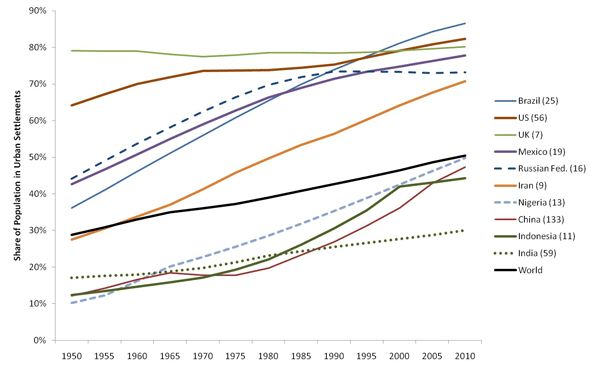
The Urban Growth Trajectory
Urbanisation experiences vary, also. The different national experiences of the past 60 years can be illustrated using ten quite different countries (Chart 1). By 2010, Brazil, US, UK, Mexico, and Iran were all heavily urbanised. But the level of urbanisation changed little for the US and the UK over thelate 20th century, while it grew rapidly in the others.
In yet another trajectory, erstwhile rapid urbanisation in Russia stalled after the mid 1980s.
 |
| Chart 1: Urbanisation Trends, Selected Nations, 1950-2010 |
Urbanisation is accelerating in China, but has flattened off in Indonesia. It has been increasing steadily in Nigeria and slowly but still steadily in India.
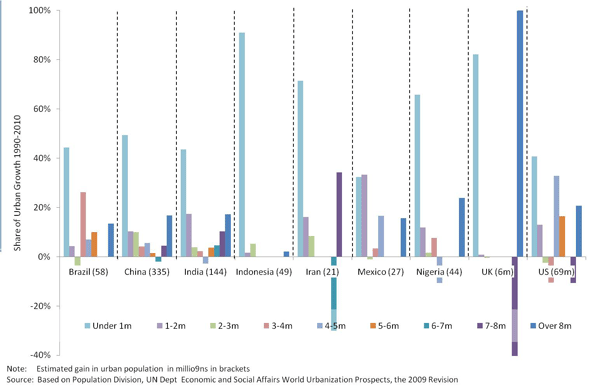
Most people moving into smaller cities
Chart 2 shows shares of growth by city size groups over the last twenty years. (Russia is omitted because urbanisation actually declined by 5.5%.)
Cities of under 1 million residents dominate gains, strongly favouring developing countries. They accounted for 90% of urban growth in Indonesia, 71% in Nigeria and 66% in Iran.
US experienced growth more or less across all size categories, although Chicago went from the 7m-8m to the 8m plus category, reducing down the former.
 |
| Chart 2: Where Populations Grew - Cities by Size Category, 1990-2010 |
Brazil, China, and Indonesia saw significant growth across the most size groups. There appears to be a contrast within these countries between the centralising influence of few large cities and dispersed urbanisation in many much smaller settlements.
(The picture for the UK reflects a gain of around 1 million people in London -- to 8.6m -- shifting it between categories. Smaller cities actually accounted for 82% of the net UK gain in urban population, suggesting a duality between the growth of the capital and decentralisation through growth in smaller settlement).
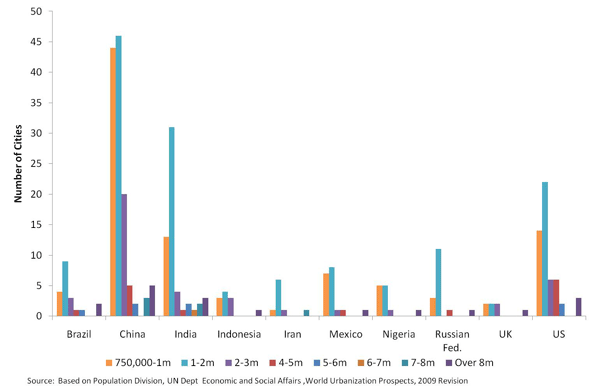
So where are the big cities?
The US has five urban agglomerations with a population of more than 5m, centred on New York, Los Angeles, Chicago, Philadelphia and Detroit (Chart 3). Compare this with China, with twelve cities of over 5m, and five cities of more than 8 million people (Shanghai, Beijing, Chongqing, Shenzhen, and Guangzhou); or India, with eight over 5m and three over 8m (Mumbai, Kolkata, and Chennai).
At the same time, China has 90 cities of between 750,000 and 2m, India 44 and the US 66. Mexico has 15, Russia 14 and Brazil 13.
 |
| Chart 3: Number of Cities by Size Category, Ten Nations 2010 |
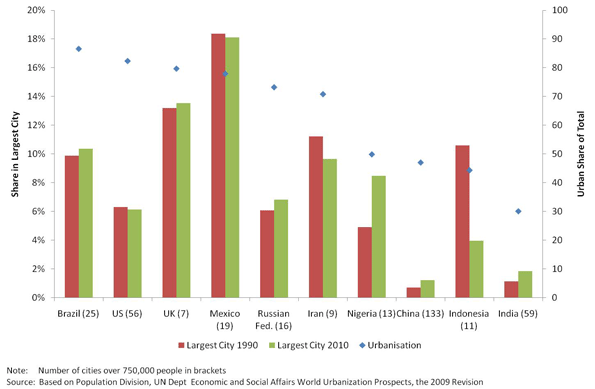
Primacy – a mixed picture
Single centres that dominate national populations are termed “primate”. Their rise and fall may be symptomatic of national economic fortunes. Excessive primacy may increase economic volatility because the contrast between a rich centre and poor periphery is politically destabilising. One centre dominating financial, human, and intellectual resources may also increase national vulnerability to structural decline.
The picture is mixed across our sample (Chart 4). Mexico City and London stand out. High levels of primacy are also evident in Iran and Indonesia, but have been easing, contrasting with Nigeria where it is increasing. It is least pronounced in the countries with the largest urban populations – China and India -- suggesting a strong population pull from a number of state or provincial capitals, as well as a host of much smaller cities.
 |
| Chart 4: Population Share of Largest City, Ten Nations, 1990 and 2010 |
So what does all this mean?
The data confirms huge diversity in the sizes of cities people live in across and within nations. It generates more questions than answers, though, the main one being whether it is relevant simply to transfer urban governance, management, or planning models from one place to another. Apart from contrasts within and between nations, it is clear that the west is no longer the focus of urbanisation and is unlikely to hold many of the answers to today’s urban growth challenges.
The evidence also indicates a tendency for urbanisation to take place in small, dispersed settlements rather than mega-cities. More modest scale makes different demands on infrastructure and institutions. It may also help manage urbanisation and ensure that benefits can be better accessed by larger numbers of people. Small cities, sub-centres in large cities, and districts of modest scale may be better suited to adaptable and innovative planning and management than large scale, extensive cities with their more centralised, remote, and inevitably bureaucratic political and administrative systems.
Very large agglomerations do exist, even if they are not as dominant in the wider urban picture as their size and profiles might suggest. The question they raise is whether they should continue to dominate national and international agenda for urban growth and management. Dispersed urbanisation may better reflect the resources and capacities needed to support an exploding urban population in the 21st century.
Phil McDermott is a Director of CityScope Consultants in Auckland, New Zealand, and Adjunct Professor of Regional and Urban Development at Auckland University of Technology. He works in urban, economic and transport development throughout New Zealand and in Australia, Asia, and the Pacific. He was formerly Head of the School of Resource and Environmental Planning at Massey University and General Manager of the Centre for Asia Pacific Aviation in Sydney. This piece originally appeared at is blog: Cities Matter.
[1] The lowest level of urbanisation incorporated by the UN depends on the conventions of individual nations but may refer to settlements with as few as 2,000 people.
[2] Treated here as North America, Northern Western and Southern Europe, and Australasia
Photo by NASA's Marshall Space Flight Center.


great post
excellent. one of the best articles I have every read. This is the information which I have been searching. Great information. Ecopolitan EC | Ecopolitan EC price | Ecopolitan | Ecopolitan Punggol | Ecopolitan Executive Condo | Sea Horizon | Sea Horizon EC | Sea Horizon Executive Condo | Sea Horizon Executive Condominium | Sea Horizon Pasir Ris | Sea Horizon EC price | Tembusu Condo | Tembusu at Kovan | Tembusu Kovan | Tembusu condo Price | Tembusu | Vue 8 residence | Vue 8 residence price | Vue 8 Condo | Vue 8 Pasir Ris | Vue 8 | the inflora | inflora condo | inflora loyang | inflora this article is worth bookmarking. keep it up !