NewGeography.com blogs
For decades taxpayers have paid billions to finance major transportation project cost overruns far exceeding the routinely low-ball forecasts available at approval time. This has been documented in a wide body of academic literature, the most important of which was conducted by Bent Flyvbjerg of Oxford University, Nils Bruzelius University of Stockholm and Werner Rothengatter of the University of Karlsruhe in Germany (Megaprojects and Risk: An Anatomy of Ambition).
Major project advocacy, however, has descended to a new low of unprecedented and absurd exaggeration. This is evident in the current public policy debate about the Sunrail commuter rail project in Orlando. Two examples make the point
Exaggeration #1: Job Creation: The Central Florida Partnership claims that Sunrail will create 10,000 jobs. "almost immediately." This would be quite an accomplishment. The Sunrail project is currently projected to cost approximately $850 million for just the first segment. Every cent of the likely cost overruns will be on a blank check drawn the account of Florida taxpayers.
At Sunrail's claimed rate of job creation, the Obama Administration's $800 million "shovel ready" stimulus program (enacted in 2009), would have "almost immediately" produced more than nine million jobs. By now, the unemployment rate would have been reduced to little above 2 percent, lower than at any point in the more than 60 years of available data. Of course, and predictably, the stimulus program did no such thing, not least because a job created by public spending is likely to destroy more than one sustainable job in the private sector.
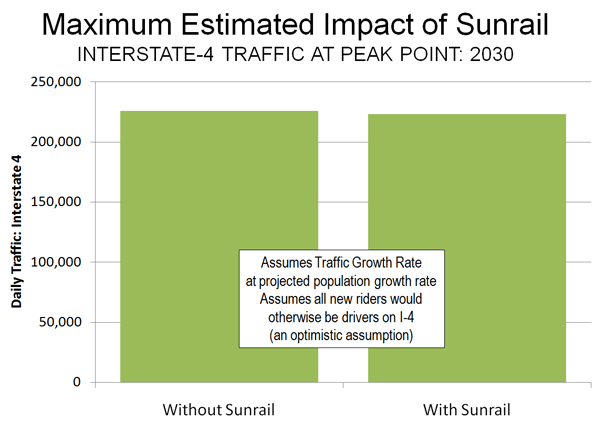
Exaggeration #2: Sunrail Will Make a Difference: The proponents imply that Sunrail will carry a significant number of trips in the Orlando area, claiming that the line will carry one lane of freeway traffic and that it will give central Florida residents an alternative to high gasoline prices. In fact, even if Sun Rail reaches its ridership projections, it would take a full day of train travel to remove less than an hour's peak hour freeway volume. Needless to say, no one will notice any fewer cars on the freeway (Figure).
Further, Sunrail will not provide an alternative to the overwhelming majority of central Floridians, since it will attract only 1,850 new round-trip riders per day by 2030 (Sunrail's number). Spending $850 million on Sunrail is the same as the taxpayers giving each new rider a gift of $450,000.
The Need to Set Rational Priorities: All of this is occurring in the face of an national fiscal crisis so severe that even the AARP has expressed its willingness to consider cuts to Social Security. As an AARP spokesperson put it "You have to look at all the tradeoffs." Indeed.
The Federal government is again offering money it does not have to entice a state (Iowa) to spend money that it does not have on something it does not need. The state of Iowa is being asked to provide funds to match federal funding for a so-called "high speed rail" line from Chicago to Iowa City. The new rail line would simply duplicate service that is already available. Luxury intercity bus service is provided between Iowa City and Chicago twice daily. The luxury buses are equipped with plugs for laptop computers and with free wireless high-speed internet service. Perhaps most surprisingly, the luxury buses make the trip faster than the so-called high speed rail line, at 3:50 hours. The trains would take more than an hour longer (5:00 hours). No one would be able to get to Chicago quicker than now. Only in America does anyone call a train that averages 45 miles per hour "high speed rail."
The state would be required to provide $20 million in subsidies to buy trains and then more to operate the trains, making up the substantial difference between costs and passenger fares. This is despite a fare much higher than the bus fare, likely to be at least $50 (based upon current fares for similar distances). By contrast, the luxury bus service charges a fare of $18.00, and does not require a penny of taxpayer subsidy. Because the luxury bus is commercially viable (read "sustainable"), service can readily be added and funded by passengers. Adding rail service would require even more in subsidies from Iowa. The bus is also more environmentally friendly than the train.
Further, this funding would be just the first step of a faux-high speed rail plan that envisions new intercity trains from Chicago across Iowa to Omaha. In the long run, this could cost the state hundreds of millions, if not billions of dollars. Already, a similar line from St. Louis to Chicago has escalated in cost nearly 10 times, after adjustment for inflation, from under $400 million to $4 billion.
Unplanned cost overruns are the rule, rather than the exception in rail projects. European researchers Bent Flyvbjerg, Nils Bruzelius and Werner Rottengather (Megaprojects and Risk: An Anatomy of Ambition) and others have shown that new rail projects routinely cost more than planned (Note 1).
Flyvbjerg et al found that the average rail project cost 45 percent more than projected and that 80 percent cost overruns were not unusual. Cost overruns were found to occur in 9 of 10 projects. Further, they found that ridership and passenger fares also often fell short of projections, increasing the need for operating subsidies.
Iowa legislators may well identify ways to spend their scarce tax funding on services that are actually needed.
______
Note: Flyvbjerg is a professor at Oxford University in the United Kingdom. Bruzelius is an associate professor at the University of Stockholm. Rothengatter is head of the Institute of Economic Policy and Research at the University of Karlsruhe in Germany and has served as president of the World Conference on Transport Research Society (WCTRS), which is perhaps the largest and most prestigious international association of transport academics and professionals.
The sustainable biking craze seems to keep rolling as more and more cities encourage commuters and wanderers to bike across town instead of drive. New programs, such as Nice Ride in Minneapolis, offer an innovative service where one can rent out a bike for a small fee and ride it across town to other stations, or continue to hold onto the bike and continue making payments.
Other cities are turning their spokes with similar programs: B-Cycle in Denver, a program in D.C., and Bixi in Montreal all have enough riders to sustain the businesses. While profit from these bikes may be viable, the question of sustainability and more improved quality of life still remains.
The way Nice Ride functions is endearingly simple: one signs up for a fixed subscription (with discounts for university students) and receives a special key that can be used at any Nice Ride station. The user slips in the key, and unlocks a bike. The bike can then be ridden across town to any station in the city, any time from April to November. In June 2010 when Nice Ride began, this simple plan garnered 10,000 trips in in its first month of use. So has this new model (and increased biking in general) for urban transportation provided any gains for the public other than fatigued legs?
It seems that the program is a perfect fit for the city’s infrastructure. The city already has 46 miles of on-street bike lanes and 84 miles of bike trails to support such a project. On top of this, the city’s bicycle culture is one of the strongest in the nation, second only to Portland, whose more temperate climate has an edge for those cyclists hoping to commute regularly.
Something that both cities have experienced is a drop in bicycle/motor vehicle crashes as more and more people decide to utilize biking as their main source of transportation. This “safety in numbers” concept has potentially attracted more and more cyclists each year leading to not only a wider understanding of the bicycle culture present, but safer roads as respect is paid to the cyclists braving the busy roads of Minneapolis and St. Paul as well.
The biking craze in the Twin Cities has also lead to the area being one of the cleanest cities in the world according to an article featured in Forbes. The research examined many different facets of a city’s infrastructure, including the emphasis the city places upon transportation, including biking. The article cites the city’s extensive use of bike lanes (as well as its transit and bus systems) as the major reason the Minneapolis/St. Paul area is so clean. The Twin Cities ranked fifth on the list, behind the likes of Calgary, Honolulu, Helsinki, and Ottawa.
So while other cities may stick to the classic emphasis on automobiles, Minneapolis has shown that biking is not only a safe mode of transportation, but one that can help to clean up the urban environment as well. Not to mention the cult cycling craze that many biking cities possess seemingly unifies an active demographic into a hopeful mode for future American transportation.
by Anonymous 06/06/2011
Anaheim Convention Center, Southern California, last week was a hot bed of one of the ultimate forms of renewable energy. The “fuel” used by wind turbines (really the wind) is free for the 30 year life span of the windmill installation, is considered inflation proof, and is 100 % domestically available.
Just a brief walk through the trade exhibition convinces any visitor of European as well as Chinese commitment to wind energy. One guest speaker, Ted Turner put it: “Just do not look at the next 30 years, look for at least a few hundred years of human energy needs.”
Conventional energy lobbyists claim that wind is unreliable and will harm operation of the grids. However, grid operators have observed that wind power is more reliable and predictable.
There are rumors that sound of operating wind will cause a variety of dangerous health effects, including headaches and disturbed sleep. The studies have shown that wind turbines at a distance of 2,000 feet (normal building codes for Wind Mills) have a dB rating close to 45 (comparing that to 55 in an average home in the USA). Normally, two people can carry on a conversation on any wind mill farm. Please remember: this energy source has no side effects such as air or water polluting emissions, no hazardous waste, and has a direct impact on reducing the public health impact of any other energy generation.
Are birds get affected by wind energy? A very legitimate question by the American Bird Conservancy needs to be addressed with honesty. The bird loss caused by buildings is about 550 million, by power lines 130 million, vehicles 80 million, poisoning by pesticide 67 million, and radio and TV towers close to 4 million. The tabulated loss by wind is under 150,000. Special attention is being paid to bats: The bats and wind energy coalition was formed in 2003 by Bat Conservation International, the U.S. Fish and wild life Service, and the National Renewable Energy Laboratory.
The view of a wind energy facility or the distance of a home from a wind mill farm had no consistent, measurable or significant impact on home values.
The current worldwide installed capacity gives a snap shot of Wind energy penetration in a given region. By 2010, the European Union was leading the world with 84,000 MW, China with 42,000 MW and the USA was at 40,000 MW. However, Denmark leads the world as percentage of total power needs fulfilled by Wind Energy: close to 20 % in 2010.
The potential of up to 20 % electricity generation that can be derived from Wind Energy is feasible, both technically as well as financially by 2030. Most land used to construct wind farms can be used for its original purpose of harvesting, grazing and farming. The actual foot print of turbine farms, roads and generating and transmitting facilities is under 3 percent of total land taken out of commission.
Wind Energy should be debated in the public forum with both energy independence and long term sustainability for our planet beyond the next election cycle.
A friend was explaining some philosophy to me the other day and he used an analogy to make his point: If you can get a cannibal to use a knife and fork, is that progress? Of course, the answer is "no". So when I heard the next day that transportation infrastructure performance in the US improved significantly at the height of the worst recession since the great depression I had to ask: is that progress?
We do not want to stop all economic progress just so that a privileged few with access to resources may enjoy an easier ride on the I-95 interstate highway between Wall Street and Congress. Stopping economic growth is not a solution to the problem of crumbling infrastructure in America.
In fact, my economic analysis shows that transportation infrastructure is a “leading indicator” of economic activity. In other words, infrastructure performance has to improve for a while – and stay improved – before economic activity will pick up in an area. Alternatively, infrastructure performance would have to decline for a while before businesses would leave that location, too. Think about it this way. From the perspective of a company already in business in a particular location, they would not pack up and leave town the first day that, for example, traffic congestion slows down the delivery of products to their customers. Companies like FedEx Freight plan distribution locations 20 years in advance. For a while, they will find a way around congestion. FedEx Freight uses elaborate technology to “route trucks around huge bottlenecks, but this adds circuitous miles and costs”. Their policy is to “minimize the impact as best you can.”
We see evidence of how business finds a way to make it work even when government and infrastructure try to stand in their way. California ranked 43rd in 1995 and fell further to 47th in 2000 and 2007 among the 50 states (plus D.C.) in the U.S. Chamber of Commerce’s transportation infrastructure performance index. Although California’s infrastructure is crumbling, businesses are finding a way to work around it. California’s economy could grow faster than the rest of the US economy this year.
In economics we talk about the efficient use of resources – getting the most out of what you have to work with. In a new study getting underway at the University of Delaware, early results indicate that businesses are operating successfully in the United States despite being hampered by problems like congestion and the lack of intermodal-connectivity (that is, being able to move products from trucks to trains and from trains to ships). California, in fact, may be a benchmark state for economic efficiency. They rank at the bottom for infrastructure performance but business is finding a way to make it work.
My old pal, Larry Summers – former Economic Advisor to President Obama and subverter of all things economic – took a last final swipe at spending on transportation infrastructure in April 2011. In his first public appearance at Harvard University after leaving the White House, he talked about investment in infrastructure as a way to “…tackle high levels of unemployment, especially among the low-skilled.” He just doesn’t get it. He continues to believe that the way to stimulate the economy is to give tax breaks to business – as if they will build their own roads. He just didn’t get that infrastructure is what supports all economic activity. It’s the stuff that business does business on, not the classical economic “capital” that business brings to the table.
In fact, it costs businesses to have to work around the crumbling infrastructure. When you ask academic, government and researchers to measure that cost, you get a wide range of views about what constitutes a direct or an indirect cost to business from traffic congestion. But some of these costs are undeniable. There is a cost of computer technology for monitoring congestion; the cost of employees for communicating with drivers about alternate routes; the cost of extra fuel; driver overtime resulting from congestion; refunds to customers for missing guaranteed delivery deadlines, etc. etc.
So, there’s a benefit to business from improving the performance of transportation infrastructure. They will be saving the money that they are spending now to work-around the infrastructure. And money not spent is at least as good as a tax break.
Disclosure: Dr. Trimbath’s research on the economic impact of transportation infrastructure performance was supported by the National Chamber Foundation and sponsored in part by FedEx Freight. The 2009 Transportation Performance Index will be released on July 19, 2011 in Washington, D.C. It will show a substantial improvement over 2008.
|


