NewGeography.com blogs
We recently noted that Ryan Avent was one third right in his recent Sunday New York Times article on urban density. Avent has posted a response suggesting that it is inappropriate to use average urban densities in urban productivity analyses, as we had done, but that "weighted average densities" should be used instead. Weighted average density was not mentioned in his New York Times article.
In the interim, we were able to find the studies on urban density and productivity that seem to match those Avent refers to in his New York Times article. There are two studies concluding that doubling employment (not population) density increases productivity by six percent (Ciccone & Hall, 1996 and Harris & Ioannides, 2000), as Avent noted. Another study (Davis, Fisher & Whited, 2007) indicates that doubling employment densities could increase productivity by as much as 28 percent, also as Avent noted.
Urban and Rural Density Combined Are Not Urban Density: In contrast to Avent's preference for weighted average density, each of the studies uses average density, like with our analysis. More importantly the econometric formulas in the studies do not include an urban density variable. The density variables in all three studies include rural areas.
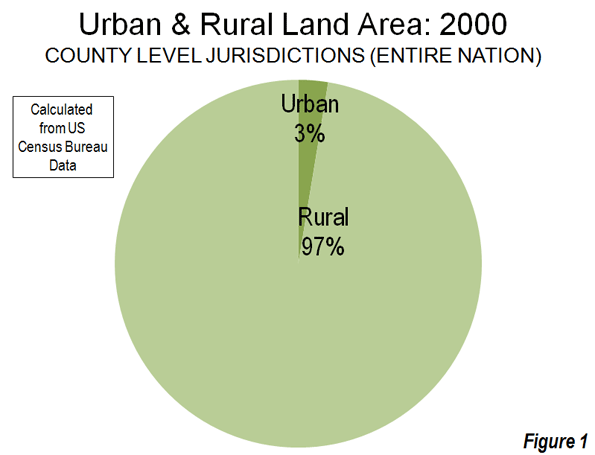
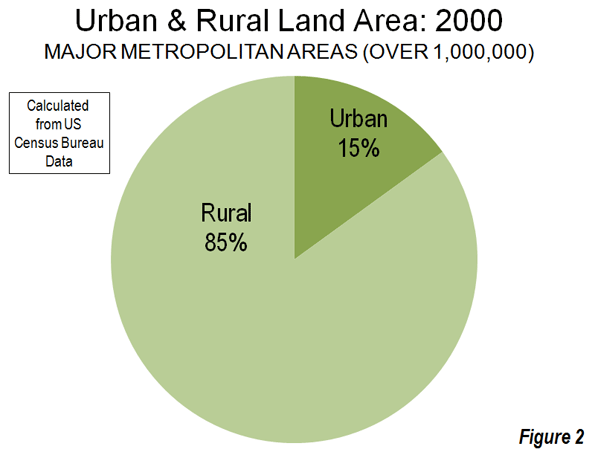
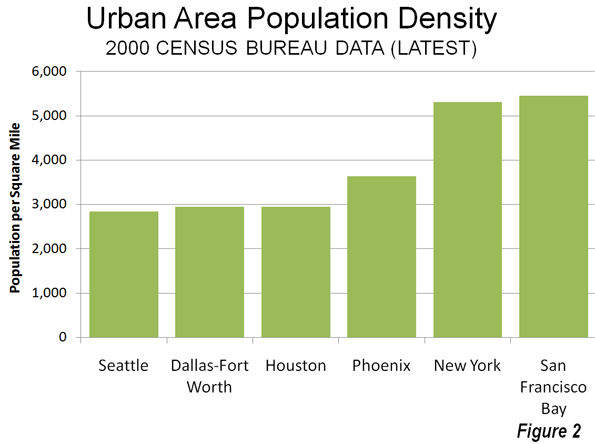
The studies use county, metropolitan area and sub-metropolitan area densities, each of which contain far more rural land than urban land. By definition, urban areas exclude rural areas and, as a result, the moment rural areas become a part of the calculation, the result cannot be urban densities. In 2000, Census Bureau data showed counties (county equivalent level jurisdictions), which comprise the entire nation, to be less than three percent urban and more than 97 percent rural (Figure 1). Metropolitan areas also have a similar predominance of rural land (Figure 1). Among major metropolitan areas (those with more than 1,000,000 population) in 2000, approximately 85 percent of the land was rural and 15 percent of the land was urban (Figure 2).
Ciccone & Hall use employment density at the county level and thus mix urban and rural densities. Harris & Ioannides use employment densities at the metropolitan statistical area or the primary metropolitan statistical area level (a sub-metropolitan designation since replaced by the more appropriately titled "metropolitan division"). Davis, Fisher & Whited use employment densities at the metropolitan statistical area level. The two studies using metropolitan areas or parts of metropolitan areas also mix urban and rural densities.
Urban Area Densities: Urban density is calculated at the urban area level, which is the area of continuous urban development. This is also called the urban footprint, which is generally indicated by the lights of the city one would see from an airplane on a clear night. Urban areas are delineated using the smallest census geographical units ("census blocks," which are smaller than census tracts) each ten years. The 2010 data will be released next year. Among urban areas, the highest density core urban area in a major metropolitan area (Los Angeles) is approximately four times the lowest (Birmingham).
Nonsensical Metropolitan Area Densities: Theoretically, metropolitan areas are labor market areas, which include a core urban area (and sometimes more than one urban area) and nearby rural areas from which people commute to work in the urban area (can be called the "commuter shed"). However, in the United States, metropolitan areas are too coarsely defined for density comparisons with one another. US metropolitan areas are composed of complete counties or, in the six New England states, complete towns. This jurisdictionally based criteria can produce metropolitan areas that are much larger than genuine labor markets in a number of cases and some that are smaller. American metropolitan areas are not spatially consistent by any functional labor market definition. Metropolitan densities are thus nonsensical, no matter what density is being measured (such as population or employment density). Among major metropolitan areas, the highest density metropolitan area (New York) is 24 times that of the lowest density (Salt Lake City), six times the maximum difference in urban area density.
Metropolitan Ireland and Happenstance: In the similarly sized San Francisco (as used by Davis, Fisher and Whited) and Riverside-San Bernardino metropolitan areas, San Francisco has 1,700 square miles of rural land, while Riverside-San Bernardino has 26,000, approximately 15 times as much. At more than 27,000 square miles, Riverside-San Bernardino covers more land area than the Republic of Ireland. The difference in population densities between metropolitan areas is determined in considerable measure by the size (land area) of the included counties, not by the number of people in cities.
If the state of California were to carve out a new county composed of western Riverside and San Bernardino counties (as Colorado created Bloomfield County in the early 2000s), the land area of the metropolitan area could be reduced 95 percent, because the remainder would not meet the criteria for inclusion in Riverside-San Bernardino. The importance of the density variable for Riverside-San Bernardino in econometric formulas would be increased many times. With only 3,100 county level jurisdictions of varying sizes, this kind of incomparability cannot help but occur. The boundaries of metropolitan areas are defined by political happenstance.
On the other hand, the nation's urban areas are built up from 7,000,000 census blocks. This permits a fine grained definition that makes urban areas appropriate for density comparisons. The definition of urban areas is beyond political fiat.
Metropolitan areas in the United States could be readily defined at the census block level, just like urban areas. Regrettably, the Office of Management and Budget missed another opportunity in the 2010 census to make the necessary criteria change. U.S. metropolitan area data is of great value for most analysis, but misleading for spatial or density analysis.
Low-Density Productivity: Subregionalizing the density and productivity analysis would pose problems. Avent uses household incomes as his standard (and we agree that cost of living differentials are important). The San Jose metropolitan area has the highest household incomes of any major metropolitan area and would therefore be among the most productive. Yet, San Jose's automobile-oriented Silicon Valley, to which much of the productivity is attributable, has a far lower employment density than the transit and pedestrian oriented cores of Manhattan and San Francisco (and yes, even not-so-transit oriented downtown Phoenix). In low-density Seattle, Microsoft's automobile oriented Redmond campus probably ranks among the most productive real estate in the country, yet its employment density (like that of Silicon Valley) pales by comparison to the higher density cores of Seattle, Phoenix, Nashville, Oklahoma City and virtually every other downtown core of a major metropolitan area.
At the End, Agreement: Avent concludes, "I just want to make sure we stop costing ourselves easy opportunities for growth." I could not agree more. It is time to abandon regulations that artificially raise housing prices, deprive households of a better standard of living, and drive them to places they would rather not live. For centuries, people have flocked to urban areas for better economic opportunities. Urban areas should be places where people can realize their aspirations, not places that repel them because it doesn't suit the interests of those already there.
Ryan Avent hits a home run, strikes out and earns a "yes, but," all in the same article ("One Path to Better Jobs: More Density in Cities") in The New York Times.
A Home Run on Housing Regulation: Avent rightly notes that the land-use and housing regulations of metropolitan areas like San Francisco have not only driven housing prices higher, but also negatively impacted economic growth. Studies in the UK, the US and the Netherlands have demonstrated that significant restrictions on land use (called smart growth or urban containment) lead to reduced employment and economic growth in metropolitan areas. His comparison to OPEC is "right on" – that metropolitan areas like San Francisco have squeezed the supply of housing, which, of course, drives up house prices, just as restricting the supply of any good or service in demand will tend to do. Avent is also right in noting that high housing prices have driven huge numbers of people out of the San Francisco Bay Area to places like Phoenix. According to the Census Bureau, nearly 2,100,000 people moved from Los Angeles, San Francisco, San Diego and San Jose between 2000 and 2009 to other parts of the country.
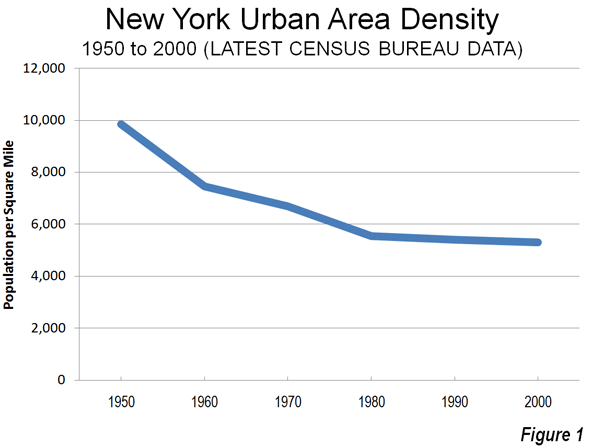
Striking Out on Density: The strikeout results from assumptions that are patently wrong. Cities (urban areas) do not get more dense as they add population. They actually become less dense. For example, the New York urban area has added 50 percent to its population since 1950, yet its population density has dropped by 45 percent (Figure 1). Between 2000 and 2010, most metropolitan population growth, whether in San Francisco, New York, Phoenix, Portland or Houston, was in the lower density suburbs (see: http://www.city-journal.org/2011/eon0406jkwc.html ). The same dispersion is occurring virtually around the world (see: http://www.demographia.com/db-evolveix.htm), from Seoul, to Shanghai, Manila and Mumbai. Rapid urban growth would mean even further dispersion and lower densities, not the higher density neighborhoods Avent imagines. Nonetheless, allowing the more affordable detached housing that people prefer would likely lead to stronger economic growth and more affluent residents in the San Francisco and other over-regulated metropolitan areas.
A "Yes, But" on Productivity: Any comparison of incomes between metropolitan areas needs to take into consideration the cost of living. For example, the San Francisco Bay Area (San Francisco/San Jose) is one of the most expensive places to live in the country. The median house price is more than 2.5 times that of Phoenix, after accounting for income differentials. Avent does not control for the difference in the cost of living, which is largely driven by the higher cost of housing. The lower cost of living neutralizes much of the impact of lower incomes (such as in Houston) in metropolitan areas like Houston, Dallas-Fort Worth, Indianapolis, etc., where the OPEC model has not been applied to land use regulation.
Finally, even controlling for the cost of living, there are substantial exceptions to any density-productivity thesis. For example, some of the greatest productivity gains information technology have come out of the Seattle area, which is the least dense major urban area in the 13 Western states, less dense than Houston, Dallas-Fort Worth and Phoenix. Even more impressively, Seattle's urban density is barely one-half that of New York or San Francisco (Figure 2), yet its gross domestic product per capita is higher than New York and within 2 percent of San Francisco/San Jose. Seattle's substantial contribution to the nation's productivity has occurred while its population density was declining nearly 15 percent (since 1980).
Avent, like many analysts before appears to presume that population growth means higher densities. In fact, urban areas grow by dispersing, not densifying.
The Economist magazine has called on the British government to cancel plans for the HS-2 high-speed rail line that would run from London to Birmingham and Manchester. The Economist said:
...these days politicians across the developed world hope new rapid trains, which barrel along at over 250mph (400kph), can do the same. But high-speed rail rarely delivers the widespread economic benefits its boosters predict. The British government—the latest to be beguiled by this vision of modernity—should think again
The government claims the line will cost £32 billion line, however the international experiences suggests a figure more on the order of £32 and the experience in this corridor itself suggests costs could rise even more (see The High Speed Rail Battle of Britain).
A principal purpose for the line is to bridge the economic gap between the economic dynamo of Southeast England (including London) and the Midlands and North of the country. This does not convince The Economist:
China suspended new projects after a fatal collision of two high-speed trains in July; Brazil delayed plans for a rapid Rio de Janeiro-São Paulo link, after lack of interest from construction firms. Yet governments remain susceptible to the idea that such projects can help to diminish regional inequalities and promote growth.
The Economist doubts this will happen:
In fact, in most developed economies high-speed railways fail to bridge regional divides and sometimes exacerbate them. Better connections strengthen the advantages of a rich city at the network’s hub: firms in wealthy regions can reach a bigger area, harming the prospects of poorer places. Even in Japan, home to the most commercially successful line, Tokyo continues to grow faster than Osaka. New Spanish rail lines have swelled Madrid’s business population to Seville’s loss. The trend in France has been for headquarters to move up the line to Paris and for fewer overnight stays elsewhere.
The Economist reminds the government that:
Britain still has time to ditch this grand infrastructure project—and should. Other countries should also reconsider plans to expand or introduce such lines. A good infrastructure scheme has a long life. But a bad one can derail both the public finances and a country’s development ambitions.
Finally, The Economist says that there is better use for the money.
The £32 billion at its disposal might well yield a higher return if it were spent on less glitzy schemes, such as road improvements and intra-city transport initiatives. If the aim is to regenerate “the north”, the current plan might prove a high-speed route in the wrong direction.
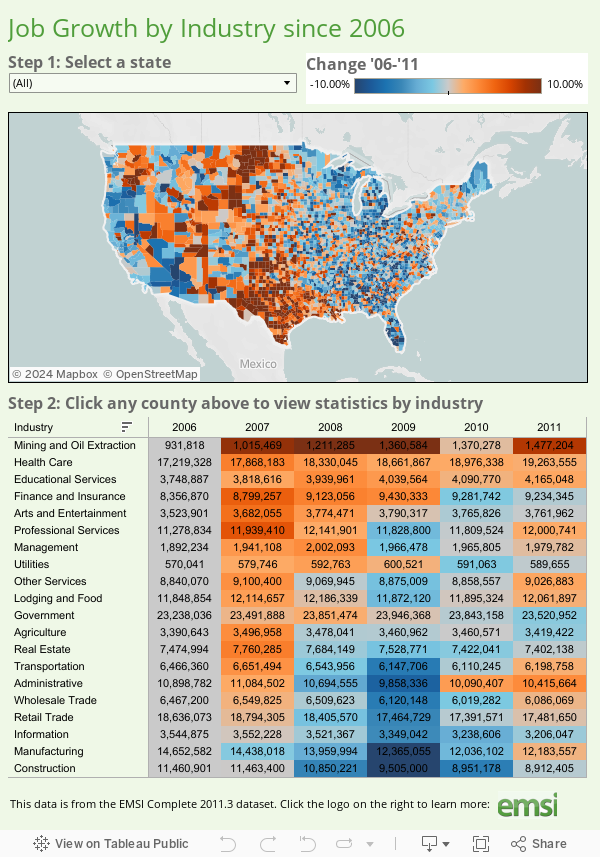
The fully interactive map below indicates job growth and decline for all US counties from 2006 to 2011. These show up as hot or cold spots; red for growth, blue for decline. You can select a state to zoom in on and find a county that way, or simply click on a county to drill in. Once you’ve chosen a county, the table under the map will show you job numbers by industry category.
The data for this graphic comes from EMSI’s Complete 2011.3 dataset, based on data from the Bureau of Labor Statistics and many other sources. Many thanks to Tableau for putting this together. If you have questions or comments about the graphic or the data behind it, please email EMSI's Josh Stevenson.
by Anonymous 08/30/2011
Eighteen months ago, on January 20, 2010, a group of influential politicians, accompanied by a large coterie of representatives of the Washington transportation community, gathered at the Capitol to urge Congress and the Obama Administration to create a "National Infrastructure Bank" to help finance infrastructure investments. The speakers included all the well-known advocates of the Bank: Pennsylvania’s Governor Ed Rendell, Senator Chris Dodd (D-CT), Rep. Rosa DeLauro (D-CT), author of an Infrastructure Bank bill (H.R. 2521), former House Majority Leader Dick Gephardt (D-MO) and Felix Rohatyn, the spiritual godfather of the movement. Standing beside them, in a gesture of support and solidarity, was a large group of executives representing the transportation industry, labor unions and advocacy groups.
For a while, it seemed like their plea would be answered. A proposal for a $30 billion infrastructure bank focused on transportation-related investments was included in the President’s FY 2011 budget proposal unveiled last September. As recently as last month, Mr. Obama was mentioning the Infrastructure Bank as part of his job stimulus plan to be unveiled after Labor Day.
But today, the idea is on life support. Neither the Senate nor the House have seen fit to include the Bank in their proposed transportation bills. Congressional Democrats and Republicans alike are in agreement that decisionmaking control over major federal investments should not be ceded to a group of "unelected bureaucrats." Rather than creating a new federal bureaucracy, they think the focus should be placed on expanding federal credit assistance tools already in place, such as the Transportation Infrastructure Finance and Innovation Act (TIFIA) and the Railroad Rehabilitation & Improvement Financing Program (RRIF).
There are other reasons for congressional skepticism. House Republicans are suspicious that the Obama-proposed Bank is nothing more than a vehicle for more stimulus spending, disguised as "capital investment." They want the Administration to be more specific about its proposal: how the Bank would be funded, what kind of investments it would fund and how the $30 billion capital would be repaid. "If this is more of the same stimulus spending, we won’t support it," Kevin Smith, spokesman for House Speaker John Boehner (R-OH) has been quoted as saying.
House Transportation and Infrastructure Committee chairman John Mica (R-FL) thinks state-level infrastructure banks would be a more appropriate means of financing major transportation projects at the state and local level. Decentralized infrastructure financing would "keep the federal financing bureaucracy at a minimum and maximize states’ financial capabilities," according to the House transportation reauthorization proposal.
Senate Democrats, while not necessarily opposed to another fiscal stimulus, want quick results. They fear that a centralized Infrastructure Bank, with its complex governance structure and layers of bureaucratic conditions, requirements and approvals would be far too slow and cumbersome to be an effective job generator. One or two years could pass before large-scale projects appropriate for Bank financing would get evaluated, selected, approved and under construction, one Senate aide told us.
What is more, there is a lack of agreement on how the proposed Infrastructure Bank should function. The Administration wants a mechanism that would serve several different purposes. In the words of Undersecretary for Transportation Policy Roy Kienitz who testified at a September 21, 2010 hearing of the Senate Banking Committee, "We need a financing institution that can provide a range of financing options— grants for projects that by their nature cannot generate revenue, and loans and loan guarantees for projects that can pay for their construction costs out of a revenue stream. In short, we need the Infrastructure Bank that the President has proposed."
But, "banks don’t give out grants, they give out loans. There is already a mechanism for giving out federal transportation grants — it’s called the highway bill," countered Sen. James Inhofe (R-OK), ranking member of the Senate Environment and Public Works (EPW) Committee.
If the proposed entity is to be a true bank – as proposed in a recent bill sponsored by Senators John Kerry (D-MA) and Kay Bailey Hutchison (R-TX) and endorsed by the AFL-CIO and the U.S. Chamber of Commerce– its scope would be confined to projects that can repay interest and principal on their loans with a dedicated stream of revenue — in other words, the Bank could finance only income-generating facilities such as toll roads and bridges. By all estimates, such projects will constitute only a small fraction of the overall inventory of transportation improvements needed to be financed in the years ahead, the bulk of which will be reconstruction of existing toll-free Interstate highways. Hence, a true Infrastructure Bank would be of limited help in creating jobs and reviving the economy, critics argue.
"A national infrastructure bank must garner broad bipartisan support to move forward," says Michael Likosky, Director of NYU's Center on Law & Public Finance and author of a recent book, Obama's Bank:Financing a Durable New Deal. "This means no grants, a multi-sector reach and a realistic idea of what projects will benefit straight away."
President Obama was expected to include the infrastructure bank among his recommended stimulus measures when he lays out his new job-creation plan before the congressional deficit reduction committee in early September. But lately, he seems to have put the idea on the back burner and turned his attention to more traditional "shovel-ready" highway investments using existing financing programs. His advisers may have concluded that the Bank will do little to stimulate immediate job creation--- and that the proposal will find little support among congressional Democrats and Republicans alike. If so, check off the Infrastructure Bank as an idea whose time had come and gone.
~~~~~~~~~~~~~~~~~~~~
Note: the NewsBriefs can also be accessed at www.infrastructureUSA.org
A listing of all recent NewsBriefs can be found at www.innobriefs.com
|