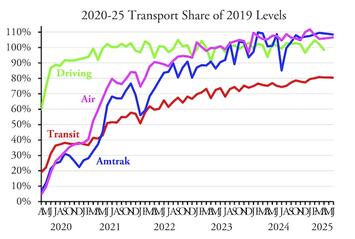
America’s public transit systems carried 80.43% as many riders in June 2025 as during the same month in 2019 according to data released by the Federal Transit Administration yesterday. This is slightly down from 80.46 percent in May, which was slightly down from 80.73 percent in April, which was slightly down from 80.91 percent in March (these numbers are slightly updated from previous reports).
Transit agencies are almost all crying that they are in a fiscal crisis, yet they operated 97.9 percent as many vehicle-miles of transit services in June 2025 as they had done in June 2019. Of course, they spent a lot more money doing it because most of them had given employees hefty pay increases, especially at the executive level.
Transit continues to do better than average in the New York urban area, which carried 85.5 percent as many riders in June as before the pandemic. Others that did above average include Miami (84.4%), Dallas-Ft. Worth (84.1%), Houston (88.4%), and Washington (89.2%). Somehow Cincinnati is at 104.2 percent, Richmond is at 121.7 percent, and Tucson is at 123.6 percent.
Chicago (68.6%), Atlanta (55.4%), Phoenix (60.9%), San Francisco-Oakland (69.8%), the Twin Cities (63.0%), Denver (61.3%), St. Louis (52.3%), and Portland (69.6%) are all still well below average. The real basket case is Memphis at 37.6 percent.
Memphis transit has had its budget cut so it only was able to provide 67 percent of pre-COVID service. But some of these poor results are despite providing high levels of service: Chicago provided more than 100 percent of pre-pandemic service, while Atlanta, San Francisco, Minneapolis-St. Paul, and Portland were all above 95 percent. Cleveland transit actually provided 112.8 percent of pre-pandemic service yet carried only 78.9 percent as many riders. Thus, spending more on transit to recover riders doesn’t always work.
The Federal Highway Administration still hasn’t published driving data for May, much less June. I’ll report those data here when they are issued.
As usual, I’ve posted an enhanced version (excel sheet) of the FTA’s spreadsheet. This includes the FTA raw data in cells A1 through KF2327; annual totals in columns KG through LD; mode totals in rows 2330 through 2351; transit agency totals in rows 2360 through 3359; and urban area totals in rows 3361 through 3851. Column LE compares June 2025 with June 2019; LF compares June 2025 with June 2024; and LG compared the year to date in 2025 with the same months in 2019.
This piece first appeared at The Antiplanner.
Randal O'Toole, the Antiplanner, is a policy analyst with nearly 50 years of experience reviewing transportation and land-use plans and the author of The Best-Laid Plans: How Government Planning Harms Your Quality of Life, Your Pocketbook, and Your Future.
Graph: chart of public transit ridership statistics, compared to other modes of transportation, courtesy The Antiplanner


