
In 2023 a total of more than 1.5 million residential building permits were issued in the United States, according to the Census Bureau. This includes 954,000 single-family dwellings (detached, and attached, which includes row houses and semi-detached). Single-family housing is ground-oriented, such that each unit has its own ground-floor exclusive entrance to the outside. There were also 547,000 multi-family units permitted.
The data cover 382 housing markets (metropolitan areas and metropolitan areas) based upon 2023 delineations.
Among the 56 major markets (major metropolitan areas), there were 486,000 single-family dwellings permitted. This is a ratio of 2.56 single-family dwellings per 1000 population.These major metropolitan areas include all that have reached at least one million population in the 2020 US census or later.
Among metro and micro areas the housing markets not reported, metro, and micros there were 359,000 permitted for a rate of 3.67 per 1000 population. This is well above the national rate of 2.85 per thousand population, nearly 45% higher than the major metropolitan area single family ratio and was the highest of the population categories.
This data and data for each of the major metropolitan areas is included in the table below.
Major Market Data
Raleigh led the major metropolitan areas with 8.10single family permits per thousand population. The balance of the top ten included Jacksonville, Houston, Charlotte, Austin, Nashville, Orlando, Dallas-Fort Worth, Phoenix and Tampa-St. Petersburg (4.50).
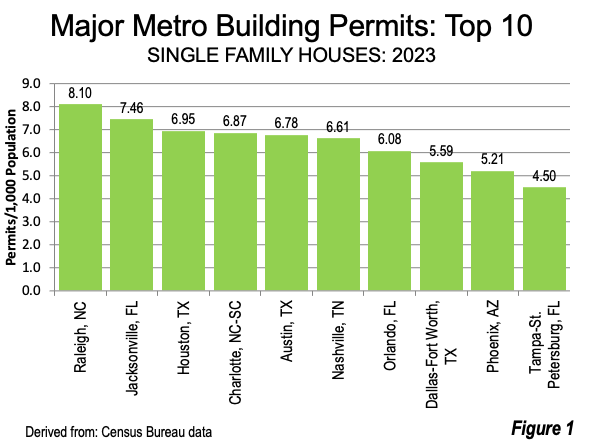
The smallest ratio of single-family dwellings was in Buffalo with 0.70 per 1,000 population, Buffalo was followed by Boston, Honolulu, Philadelphia, Providence, Providence, Chicago, Miami, San Diego, Philadelphia, and Los Angeles (1.06).

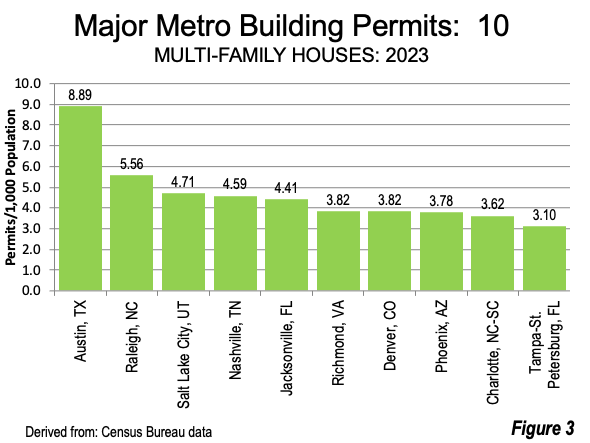
Austin led the nation in multifamily dwellings per thousand population at 6.78, followed by Raleigh, Salt Lake City, Nashville, Jacksonville, Richmond, Denver, Phoenix, Charlotte and Tampa-St. Petersburg (3.10).
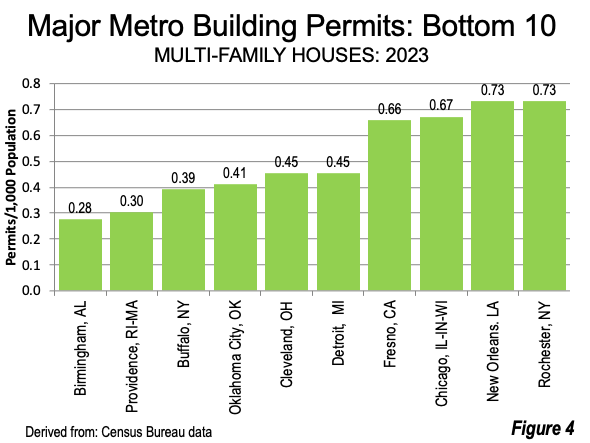
The smallest number of multifamily dwellings per 1000 population was in Birmingham (0.28), followed by Providence, Buffalo, OklahomaCity, Cleveland, Detroit, Fresno, Chicago, New Orleans, and Rochester (0.73).
Top ranked Austin had about nine times the single-family ratio per 1,000 residents as bottom ranked Birmingham.
Single-Family Housing Market Penetration
Over the last 50 plus years since 1970, single-family building permits have averaged approximately 70% of total residential building permits, according to ChatGPT (artificial intelligence service). In 2023, the single-family ratio was 63.1%, indicating a strong market preference.
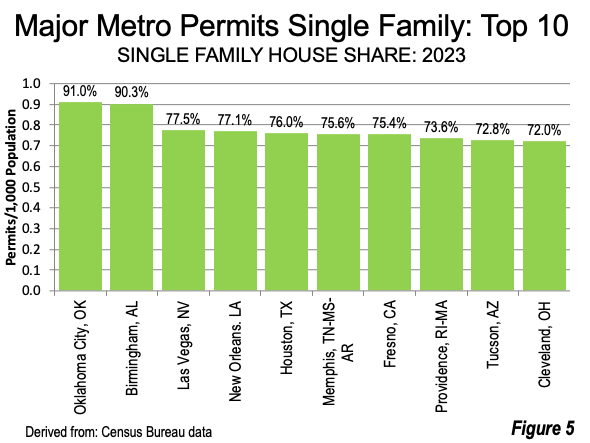
Oklahoma City had the highest ratio of single-family permits to overall residential permits at 91.0%. It was followed by Birmingham, Las Vegas, New Orleans, Euston, Memphis, Fresno, Providence, Tucson, and Cleveland (72.0%).
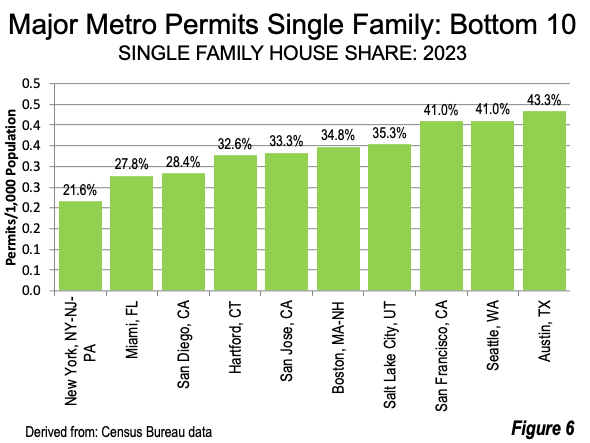
Among the major metropolitan areas with the lowest single family to total permit ratio were New York (21.6%), Miami, San Diego, Hartford, San Jose, Boston, Salt Lake City, San Francisco, Seattle, and Austin (43.3%).
There is a strong correlation between the numbers of single family and multi=family permits issued by metropolitan areas, with a correlation coefficient of 0.67, which is statistically significant at the 99% confidence level. This indicates a strong association between the extent of single-family and multi-family permits.
Residential Building Permits by Size of Housing Market
At the national level, 2.85 new single-family houses were permitted per 1,000 population and 1.66 total newmulti-family dwellings permitsper 1,000 population.

Figure 7 summarizes the data by the population of housing markets.
The highest single-family permit ratio is 3.67 per 1,000,000 population, in the 326 housing markets that have fewer than 1,000,000 residents, which is about one-quarter above the national average of 3.85.
The 5,000,000 to 9,999,999 category has the second largest single-family ratio, at 3.28. This category includes housing markets that have had strong population growth over the past 15 years, such as Dallas-Fort Worth, Houston, Atlanta and Phoenix, which led the nation in single family permits in the last year. The large permitting volumes are to be expected in such an environment.
The 1,000,000 to 2,499,999 category and the 2,500,000 to 4,999,999 categories are somewhat below the national averages.
The balance of the nation has a single-family ratio of 2.33. This category includes smaller metropolitan and micropolitan areas, as well as areas that are largely rural.
The highest multi-family permit ratios were 2.17 in the 2,500,000 to 4,999,999 and 2.14 in the 5,000,000 to 9,999,999 categories, about 30% above the national average.
The over 10 million category, composed of New York and Los Angeles, has a multi-family ratio of 1.94, higher than its single-family ratio, and is unique in this regard. Moreover, the defeat of California’s Proposition 33, which would have granted local authorities could work to maintain or even improve the multi-family ratio in Los Angeles.
The lowest multi-family permit ratio is 0.41 per 1,000 population was in the balance of the nation, three-quarters below the national average.
Perhaps the most significant finding is the highest (3.67) single-family ratio per 1,000 population in the metropolitan and micropolitan areas (core based statistical areas or CBSAs) with fewer than 1,000,000 residents, which could reflect the strong inbound net domestic migration, especially to these smaller CBSAs from the areas with larger populations (Figure 8). Housing matters, but so does the kind of housing being built. Areas that don’t build them tend to lose to areas that do.
Wendell Cox is principal of Demographia, an international public policy firm located in the St. Louis metropolitan area. He is a Senior Fellow with the Frontier Centre for Public Policy in Winnipeg and a member of the Advisory Board of the Center for Demographics and Policy at Chapman University in Orange, California. He has served as a visiting professor at the Conservatoire National des Arts et Metiers in Paris. His principal interests are economics, poverty alleviation, demographics, urban policy and transport. He is co-author of the annual Demographia International Housing Affordability Survey and author of Demographia World Urban Areas.
Mayor Tom Bradley appointed him to three terms on the Los Angeles County Transportation Commission (1977-1985) and Speaker of the House Newt Gingrich appointed him to the Amtrak Reform Council, to complete the unexpired term of New Jersey Governor Christine Todd Whitman (1999-2002). He is author of War on the Dream: How Anti-Sprawl Policy Threatens the Quality of Life and Toward More Prosperous Cities: A Framing Essay on Urban Areas, Transport, Planning and the Dimensions of Sustainability.
Photo: Photograph: Detached house in the Salinas (California) metropolitan area via Wikimedia under CC 3.0 License.
Table back to reference.
| Residential Building Permits: 2023 Reported Metropolitan & Micropolitan Areas & National |
||||||||
| Metropolitan Area (Shortened Name) | Single Family Permits |
Per 1,000 Pop. |
Rank | Total Residential Permits |
Per 1,000 Pop. |
Rank | Single Family Share |
Rank |
| Atlanta, GA | 24,136 | 3.83 | 13 | 38,639 | 6.13 | 14 | 62.5% | 23 |
| Austin, TX | 16,776 | 6.78 | 5 | 38,773 | 15.68 | 1 | 43.3% | 47 |
| Baltimore, MD | 3,800 | 1.34 | 39 | 7,539 | 2.66 | 41 | 50.4% | 38 |
| Birmingham, AL | 3,064 | 2.59 | 22 | 3,392 | 2.86 | 38 | 90.3% | 2 |
| Boston, MA-NH | 3,764 | 0.77 | 52 | 10,822 | 2.20 | 45 | 34.8% | 51 |
| Buffalo, NY | 809 | 0.70 | 53 | 1,261 | 1.09 | 56 | 64.2% | 20 |
| Charlotte, NC-SC | 19,266 | 6.87 | 4 | 29,419 | 10.49 | 5 | 65.5% | 18 |
| Chicago, IL-IN-WI | 8,802 | 0.95 | 48 | 15,028 | 1.62 | 52 | 58.6% | 30 |
| Cincinnati, OH-KY-IN | 4,008 | 1.76 | 34 | 6,241 | 2.75 | 39 | 64.2% | 19 |
| Cleveland, OH | 2,514 | 1.16 | 40 | 3,491 | 1.62 | 53 | 72.0% | 10 |
| Columbus, OH | 5,498 | 2.52 | 25 | 11,440 | 5.25 | 18 | 48.1% | 40 |
| Dallas-Fort Worth, TX | 45,292 | 5.59 | 8 | 68,029 | 8.40 | 9 | 66.6% | 16 |
| Denver, CO | 9,176 | 3.05 | 20 | 20,650 | 6.87 | 13 | 44.4% | 44 |
| Detroit, MI | 4,761 | 1.10 | 41 | 6,734 | 1.55 | 54 | 70.7% | 11 |
| Fresno, CA | 2,378 | 2.02 | 32 | 3,154 | 2.67 | 40 | 75.4% | 7 |
| Grand Rapids, MI | 2,491 | 2.14 | 30 | 3,603 | 3.10 | 36 | 69.1% | 13 |
| Hartford, CT | 690 | 0.60 | 56 | 2,114 | 1.84 | 48 | 32.6% | 53 |
| Honolulu, HI | 803 | 0.81 | 51 | 1,851 | 1.87 | 47 | 43.4% | 46 |
| Houston, TX | 52,230 | 6.95 | 3 | 68,755 | 9.15 | 6 | 76.0% | 5 |
| Indianapolis, IN | 7,454 | 3.49 | 16 | 12,554 | 5.87 | 16 | 59.4% | 25 |
| Jacksonville, FL | 12,777 | 7.46 | 2 | 20,326 | 11.86 | 3 | 62.9% | 21 |
| Kansas City, MO-KS | 4,577 | 2.06 | 31 | 7,514 | 3.38 | 32 | 60.9% | 24 |
| Las Vegas, NV | 10,127 | 4.33 | 11 | 13,073 | 5.59 | 17 | 77.5% | 3 |
| Los Angeles, CA | 13,527 | 1.06 | 44 | 30,767 | 2.40 | 44 | 44.0% | 45 |
| Louisville, KY-IN | 3,012 | 2.21 | 29 | 6,731 | 4.93 | 22 | 44.7% | 43 |
| Memphis, TN-MS-AR | 3,066 | 2.30 | 27 | 4,058 | 3.04 | 37 | 75.6% | 6 |
| Miami, FL | 5,922 | 0.96 | 47 | 21,320 | 3.45 | 30 | 27.8% | 55 |
| Milwaukee, WI | 1,678 | 1.08 | 42 | 2,844 | 1.82 | 49 | 59.0% | 29 |
| Minneapolis-St. Paul, MN-WI | 8,417 | 2.27 | 28 | 18,633 | 5.02 | 19 | 45.2% | 42 |
| Nashville, TN | 13,908 | 6.61 | 6 | 23,558 | 11.20 | 4 | 59.0% | 28 |
| New Orleans, LA | 2,367 | 2.46 | 26 | 3,072 | 3.19 | 35 | 77.1% | 4 |
| New York, NY-NJ-PA | 13,628 | 0.70 | 54 | 63,030 | 3.23 | 33 | 21.6% | 56 |
| Oklahoma City, OK | 6,129 | 4.15 | 12 | 6,736 | 4.56 | 24 | 91.0% | 1 |
| Orlando, FL | 17,141 | 6.08 | 7 | 25,415 | 9.02 | 7 | 67.4% | 15 |
| Philadelphia, PA-NJ-DE-MD | 6,473 | 1.04 | 45 | 12,019 | 1.92 | 46 | 53.9% | 36 |
| Phoenix, AZ | 26,438 | 5.21 | 9 | 45,616 | 9.00 | 8 | 58.0% | 31 |
| Pittsburgh, PA | 3,348 | 1.38 | 38 | 6,294 | 2.60 | 42 | 53.2% | 37 |
| Portland, OR-WA | 6,448 | 2.57 | 23 | 11,382 | 4.54 | 25 | 56.7% | 32 |
| Providence, RI-MA | 1,421 | 0.85 | 50 | 1,930 | 1.15 | 55 | 73.6% | 8 |
| Raleigh, NC | 12,229 | 8.10 | 1 | 20,619 | 13.66 | 2 | 59.3% | 26 |
| Richmond, VA | 4,814 | 3.57 | 15 | 9,973 | 7.39 | 11 | 48.3% | 39 |
| Riverside-San Bernardino, CA | 12,671 | 2.70 | 21 | 20,268 | 4.32 | 26 | 62.5% | 22 |
| Rochester, NY | 952 | 0.90 | 49 | 1,723 | 1.64 | 51 | 55.3% | 35 |
| Sacramento, CA | 8,119 | 3.35 | 18 | 11,941 | 4.93 | 21 | 68.0% | 14 |
| Salt Lake City, UT | 3,259 | 2.57 | 24 | 9,235 | 7.28 | 12 | 35.3% | 50 |
| San Antonio, TX | 9,198 | 3.40 | 17 | 16,485 | 6.10 | 15 | 55.8% | 34 |
| San Diego, CA | 3,257 | 1.00 | 46 | 11,469 | 3.51 | 29 | 28.4% | 54 |
| San Francisco, CA | 3,085 | 0.68 | 55 | 7,530 | 1.65 | 50 | 41.0% | 49 |
| San Jose, CA | 2,073 | 1.07 | 43 | 6,227 | 3.20 | 34 | 33.3% | 52 |
| Seattle, WA | 7,060 | 1.75 | 36 | 17,223 | 4.26 | 27 | 41.0% | 48 |
| St. Louis, MO-IL | 4,679 | 1.67 | 37 | 7,107 | 2.54 | 43 | 65.8% | 17 |
| Tampa-St. Petersburg, FL | 15,034 | 4.50 | 10 | 25,386 | 7.59 | 10 | 59.2% | 27 |
| Tucson, AZ | 3,826 | 3.60 | 14 | 5,255 | 4.94 | 20 | 72.8% | 9 |
| Tulsa, OK | 3,485 | 3.34 | 19 | 5,009 | 4.79 | 23 | 69.6% | 12 |
| Virginia Beach-Norfolk, VA-NC | 3,415 | 1.91 | 33 | 6,114 | 3.42 | 31 | 55.9% | 33 |
| Washington, DC-VA-MD-WV | 11,016 | 1.75 | 35 | 23,493 | 3.73 | 28 | 46.9% | 41 |
| Total: Major Metros | 486,288 | 2.56 | 882,864 | 4.64 | 55.1% | |||
| Other Reported Metros & Micros | 358,671 | 3.67 | 499,881 | 5.12 | 71.8% | |||
| Total Metro/Micro Reported | 844,959 | 2.93 | 1,382,745 | 4.80 | 61.1% | |||
| Outside Reported Metros/Micros | 109,238 | 2.33 | 128,357 | 2.73 | 85.1% | |||
| United States | 954,197 | 2.85 | 1,511,102 | 4.51 | 63.1% | |||
| Single Family: Detached and Attached (semi-detached and townhouses) | ||||||||
| Derived from US Census Bureau data | ||||||||


