
For the last two centuries, one of the most important demographic trends has been the movement of people from rural areas to the cities. It has been estimated that in 1800, the world was only 3% urban, meaning that it was 97% rural.In 1800, there was only one urban area in the world with more than 1,000,000 population — Beijing — and it subsequently fell below that level. As late as 1900, there were only 16 urban areas in the world with more than 1,000,000 population. Now there are more than 530. The world urban population share is approaching 60%.
Yet urbanization in Canada appears to be slowing substantially, likely due to the impossibly unaffordable markets, especially Vancouver and Toronto. This article discusses net internal migration within Canada (excludes international migration), which has suddenly turned against the largest cities (metropolitan areas, which is the generic economic definition of a city).
This article supplements my recent commentary in The Financial Post, entitled “Opinion: “Want to help solve Canada's housing crisis? Move: The latest StatCan data reveal Canadians are leaving the priciest cities and moving to rural areas, reversing the traditional trend. ”The principal message of the piece is that there has been no housing affordability progress, despite a number of proposals. However, the net migration numbers (described below) show that people are taking matters into their own hands, moving to areas that more affordable.
Moving to Smaller Cities and Rural Areas
Over the past five years, the largest cities in Canada — the census metropolitan areas (CMAs, which have populations of more than 100,000)have been losing net internal migrants (people who move from one part of the nation to another) to cities with smaller populations (census agglomerations or CAs, which have urban cores of more than 10,000 but are not large enough to be CMAs) and to areas that are neither CMAs or CAs.
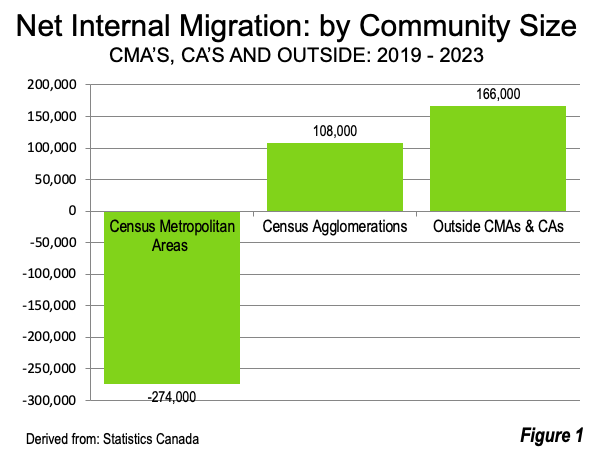
Between 2018 and 2023, according to Statistics Canada (the principal federal government statistics organization), the CMAs lost a net 274,000 internal migrants to the CAs and the areas outside the CMAs and CAs. The smaller CAs, gained 108,000 net internal migrants, while the areas outside the CMAs and CAs gained 166,000. Not only are the largest cities losing net internal migrants to smaller areas, but the areas with the smallest populations, those outside the CMAs and CAs, gained the most, with 61% of the total net internal migration (Figure 1).
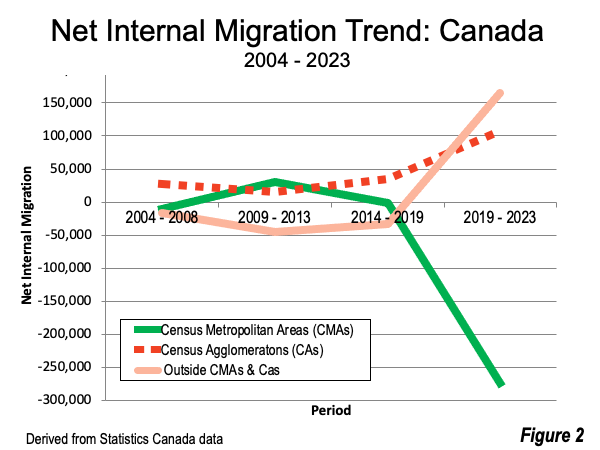
The net internal migration loss among the highly urban CMAs was stunning. In the previous five years (2014-2018), the CMAs lost less than 1,000 net internal migrants. This loss was multiplied by more than 350 times, to the loss of 274,000 in 2019-2023. Among the CAs, there was a tripling from 34,000 in 2014-2018 to the current 108,000. Meanwhile, the areas outside the CMAs and CAs, which has much of Canada’s rural population went from a loss of 34,000 to a gain of 166,000, an overall gain of 200,000 (Figure 2).
Total Net Internal Migration Moves: 2004-2023
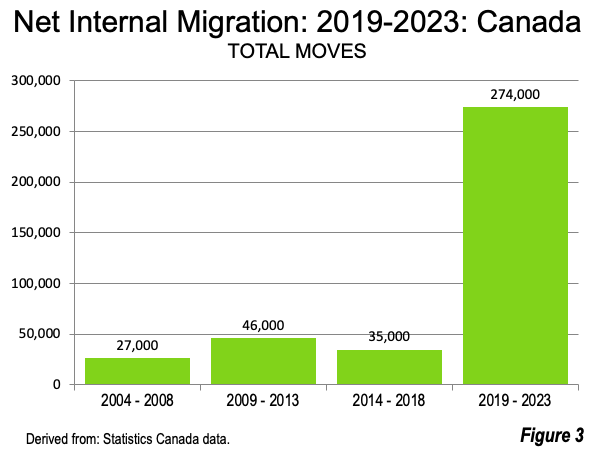
The change has occurred over a very short period of time and is very substantial. This is illustrated by the total “moves” represented in the net internal migration data. The 273,800 moves during the last five years (2019-2023) are 7.9 times that of the previous five years (2014-2018). This is an increase of 6,900% from the three previous five-year average (2004-2008, 2009-2013 and 2014-2018) total internal migration between the three categories (Figure 3).
Net Internal Migration at the Area Level
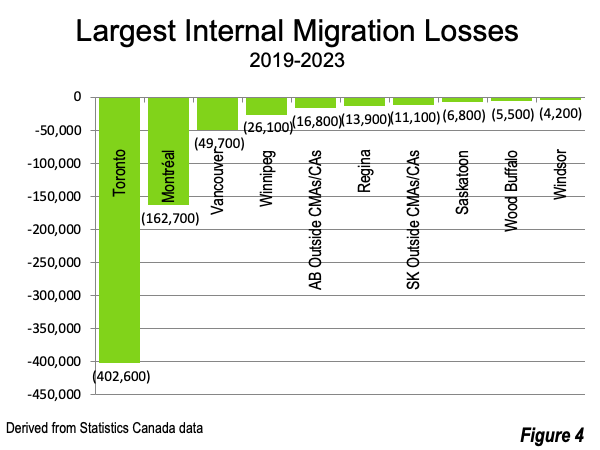
The big news is the exodus from metro Toronto. Between 2019 and 2023, Toronto lost 403,000 net internal migrants. Montréal was a distant second at 163,000, while Vancouver lost 50,000. Winnipeg lost 26,000 net internal migrants. (Figure 4).
The biggest gainers were areas outside the Ontario CMAs/CAs at 78,000. Quebec almost equaled this, with a non-CMA/CA gain of 76,000. Calgary gained 43,000, the largest gain among the CMAs. Ottawa-Gatineau, the national capital, which straddles the Ontario-Quebec border gained 37,000. Oshawa, bordering Toronto on the East, gained 35,000, while Edmonton, capital of Alberta, gained 29,000. Victoria, capital of British Columbia, gained 25,000, while St. Catharines-Niagara gained 21,000 (Figure 5).
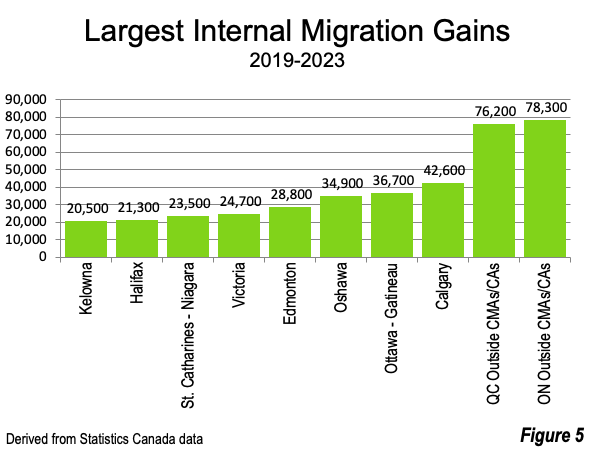
Halifax led a new trend of net internal migration to the Maritime provinces (Nova Scotia, New Brunswick and Prince Edward Island), gaining 20,000 net internal migrants (Figure 5). Moncton (now the largest city in New Brunswick), Saint John and Fredericton are also welcoming net internal migration, as well as Charlottetown in Prince Edward Island.
Cost of Living: Driving the Demographics
What is behind this? Certainly, the differing cost of living between all of these areas is a major factor. Moreover, as University of Toronto Professor Richard Florida notes, differences in the cost of living are driven by the cost of housing.
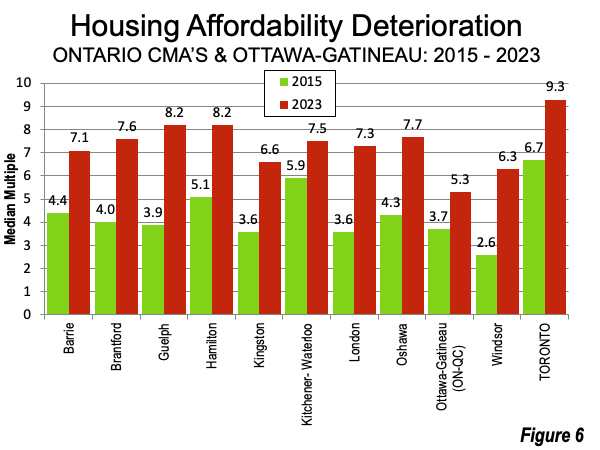
Toronto has seen its income adjusted cost of housing more than double since 2005, under the Places to Grow urban containment policy. There may, however, be good news. A just enacted Ontario law that liberalizes the process for cities to expand their settlement boundaries could, at least to some degree, address the shortage of land for ground-oriented dwellings (detached and town house) and help lower the cost of land. Toronto’s net internal migration has been heavily toward other areas of the province, such as London, Kitchener-Waterloo, Guelph, the Kawartha Lakes, Peterborough, St. Catharines-Niagara, and as noted above, to Ontario areas completely outside of the existing cities. The problem is, however, that these markets did not have enough approved land for development, and house prices have escalated (Figure 6). It is not surprising that people are beginning to move to the Maritimes.
The largest share of the Montréal outmigration has been to the Quebec areas outside CMAs and CAs, two-province CMA of Ottawa-Gatineau Trois-Rivières, Drummondville, Granby, Saguenay, Sainte-Agathe-des-Montsand Sherbrooke.
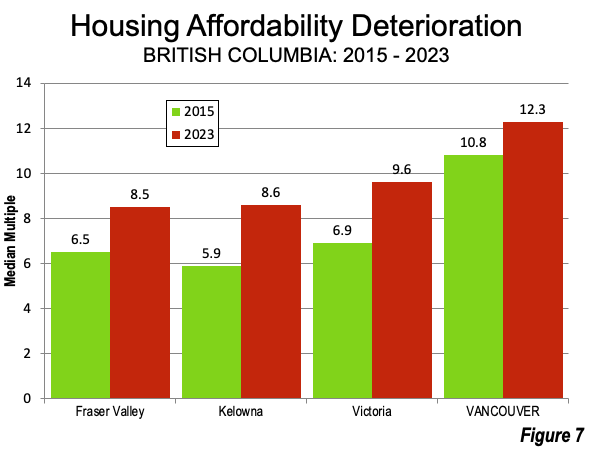
A similar dynamic is occurring in Vancouver, where the outmigration has been dominated by moves to the Fraser Valley, Kelowna and Kamloops as well as to the Vancouver Island markets of Victoria, Nanaimo and Courtenay . As in Ontario, these markets have been subject to the provincial urban containment policy, and seen substantial losses in housing affordability (Figure 7).
Net Internal Migration at the Provincial Level
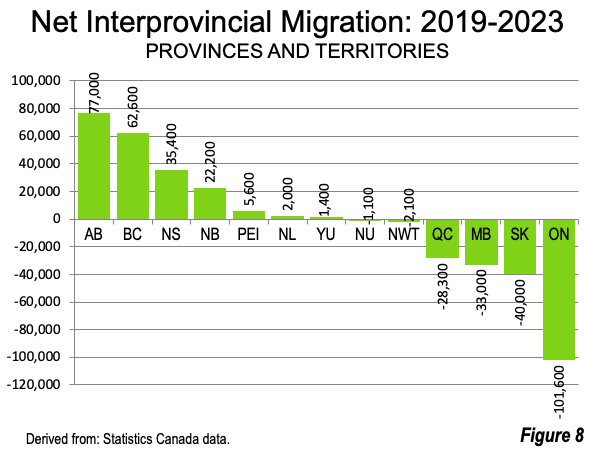
During the last five years, the largest net internal migration gains have been in Alberta and British Columbia. Further, all of the Atlantic provinces have had gains (Nova Scotia, New Brunswick, Prince Edward Island and Newfoundland and Labrador. The Yukon also had positive net internal migration.
The largest provincial loss was in Ontario, followed by Saskatchewan, Manitoba, Quebec, Northwest Territories and Nunavut (Figure 8).
Canada: The Need for Making Affordable Land Available
Canadians are fortunate to have desirable places to move where housing is relatively affordable. Regrettably, the destinations of the largest movements of net internal migration — in Ontario outside Toronto and British Columbia outside Vancouver — remain under the provincial land use regulations that have virtually destroyed the competitive market for land. I expect that net internal migration will increasingly be toward the Atlantic and Prairie provinces, as well to principally rural areas across the nation. Without assuring there is a sufficient supply of land, these newer destinations could suffer a similar fate, as Vancouver and Toronto style cost of living crises spread nearly everywhere.
Wendell Cox is principal of Demographia, an international public policy firm located in the St. Louis metropolitan area. He is a Senior Fellow with the Frontier Centre for Public Policy in Winnipeg and a member of the Advisory Board of the Center for Demographics and Policy at Chapman University in Orange, California. He has served as a visiting professor at the Conservatoire National des Arts et Metiers in Paris. His principal interests are economics, poverty alleviation, demographics, urban policy and transport. He is co-author of the annual Demographia International Housing Affordability Survey and author of Demographia World Urban Areas.
Mayor Tom Bradley appointed him to three terms on the Los Angeles County Transportation Commission (1977-1985) and Speaker of the House Newt Gingrich appointed him to the Amtrak Reform Council, to complete the unexpired term of New Jersey Governor Christine Todd Whitman (1999-2002). He is author of War on the Dream: How Anti-Sprawl Policy Threatens the Quality of Life and Toward More Prosperous Cities: A Framing Essay on Urban Areas, Transport, Planning and the Dimensions of Sustainability.
Photo: Moncton (Largest CMA in New Brunswick) via Wikimedia under CC 3.0 License.


