
The latest American Community Survey data (2022) indicates that higher density condo living is strongly correlated with lower rates of home ownership than among detached or attached houses. The table below provides US data as well as data for the 56 major metropolitan areas by residential building density.
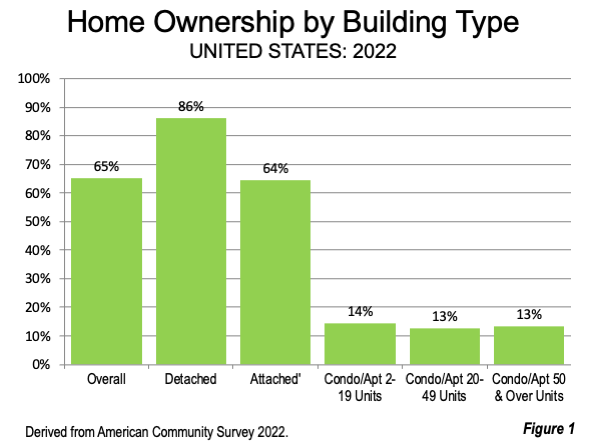
National Home Ownership by Type of Residential Building: Overall, 65.2% of US households owned their own homes (with or without mortgages) in 2022. Among the residential building types, home ownership was the highest in detached houses (86.1%).Attached housing (row houses, semi-detached and townhouses) had a home ownership rate of 64.5%. Multi-family housing had much smaller home ownership ratios, with 14.3% in buildings with under 20 units, 12.6% in buildings with from 20 to 49 units and 13.5% in buildings with 50 or more units. The latter category would include the high density, often high rise buildings that have been constructed in large numbers comparatively recently (Figure 1).
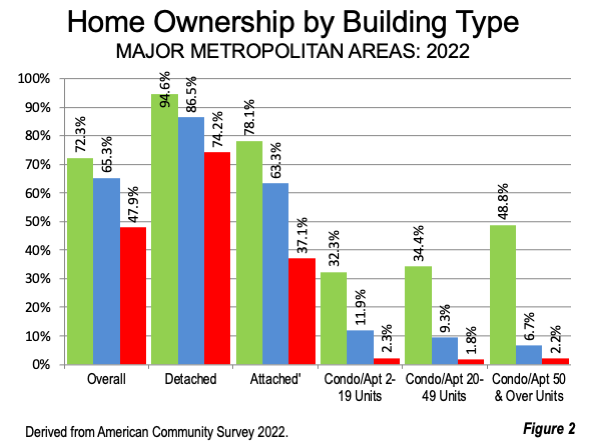
Major Metropolitan Area Home Ownership: Grand Rapids, Michigan had the highest overall home ownership rate, at 72.3%, then surprisingly followed closely by Detroit (71.5%), which for all its bad press has generally very attractive suburbs (Note). Minneapolis-St. Paul has a home ownership rate of 70.5%, a rate matched by Pittsburgh and followed by St. Louis, at 69.7%. All five of the top major metropolitan areas for home ownership are in the Midwest.
The lowest overall home ownership rates are in Los Angeles (47.9%), New York, San Diego, San Jose and Fresno (55.0%).
Detached Housing Home Ownership: Hartford has the highest home ownership rate in detached housing at 94.6%. Minneapolis-St. Paul, Boston, Philadelphia and Baltimore also rank highly, with at least 93.6%. The lowest detached housing home ownership rates are in Fresno (74.2%), Memphis, Los Angeles, Las Vegas and Oklahoma City (79.2%).
Attached Housing Home Ownership: The leaders in attached home ownership are Chicago, Washington, Minneapolis-St. Paul, New York and Denver, all at 74% or more. The lowest home ownership rates in attached housing are in Oklahoma City, Memphis, New Orleans and Fresno, all above 42%.
Multi-Family 2-19 Unit Home Ownership: Among buildings with from 2-19 apartments (condos), Honolulu ranks the highest in home ownership (43.6%), followed by Boston, Chicago, Miami and New York. The lowest home ownership rates in buildings with from 2-19 units are in Fresno (2.3%), Tulsa, San Antonio and Oklahoma City (3.4%).
Multi-Family 20-49 Unit Home Ownership: In the 20-49 unit buildings, Miami ranks the highest in home ownership at 34.4%, followed by Honolulu, Chicago, Tampa-St. Petersburg and Washington (25.3%. The lowest 20-49 unit building homeownership is in San Antonio (1.8%), Oklahoma City, Richmond, Dallas-Fort Worth and Riverside-San Bernardino (2.9%).
Multi-Family 50 Unit & Over Home Ownership: In the densest category, buildings with 50 or more units have their highest home ownership rate in Honolulu (48.8 multi%), Miami, Chicago, New York and Tampa-St. Petersburg (21.9%). The lowest home ownership rates in 50+ unit buildings are in Fresno (2.2%), Sacramento, Raleigh, Oklahoma City and Indianapolis (2.9%).
Summary of Home Ownership by Building Type: Home ownership in the United States is concentrated in single-family houses --- detached and attached. The lowest home ownership in houses is 37.1% in Oklahoma City. Only Honolulu (48.8%) and Miami (38.0%) have greater home ownership, both in the 50 units and higher category.
The median home ownership rate among the major metros was 12% or less in each of the three condo/apartment categories, compared to the 63% in attached housing and 87% in detached housing (Figure 2)
Prospects: The dominance of single-family home ownership is powerful evidence that the American Dream of home ownership continues, and is focused in houses, rather than in condos or apartments. It is not known how much of the low home ownership rates among condos and apartments is due to low incomes, preference for renting, family structure or other causes. Much of urban planning and various state and local governments have embraced densification as the “solution,” to the housing affordability crisis. These data should be of concern, to the extent that they are evidence of higher prices in condos and apartments, which is likely to repel any significant densification. Moreover, there is strong evidence that higher densities do not improve housing affordability, to which the unprecedented densification of Vancouver is witness.
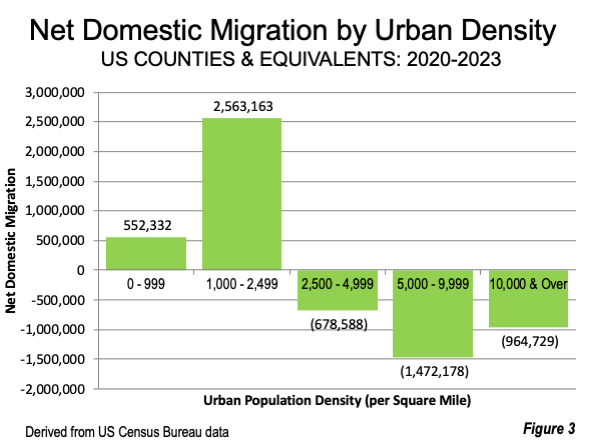
At the same time, over the last three years there has been a movement of 3.2 million net domestic migrants away from counties with higher urban population densities to those with lower urban densities. The net effect is that the counties with lower urban densities have gained 6.4 to residents compared to those with higher urban densities (Figure 3). It is doubtful that a large share of this movement is people seeking to live in apartments or condos.
Note: While the city of Detroit has lost about 2/3 of its population since 1950 (1.2 million), the suburbs have gained about 2.2 million, according to Census Bureau urban area data.
Wendell Cox is principal of Demographia, an international public policy firm located in the St. Louis metropolitan area. He is a Senior Fellow with the Frontier Centre for Public Policy in Winnipeg and a member of the Advisory Board of the Center for Demographics and Policy at Chapman University in Orange, California. He has served as a visiting professor at the Conservatoire National des Arts et Metiers in Paris. His principal interests are economics, poverty alleviation, demographics, urban policy and transport. He is co-author of the annual Demographia International Housing Affordability Survey and author of Demographia World Urban Areas.
Mayor Tom Bradley appointed him to three terms on the Los Angeles County Transportation Commission (1977-1985) and Speaker of the House Newt Gingrich appointed him to the Amtrak Reform Council, to complete the unexpired term of New Jersey Governor Christine Todd Whitman (1999-2002). He is author of War on the Dream: How Anti-Sprawl Policy Threatens the Quality of Life and Toward More Prosperous Cities: A Framing Essay on Urban Areas, Transport, Planning and the Dimensions of Sustainability.
Lead image: 432 Park Avenue, New York (condominium building) via Wikimedia licensed under CC 4.0.
Table 1 back to reference
| HOME OWNERSHIP BY BUILDING TYPE | |||||||
| Rank | Major Metropolitan Area | Overall | Detached | Attached | Condo 2-19 |
Condo 20-49 |
Condo 50+ |
| 20 | Atlanta, GA | 66.50% | 85.70% | 73.80% | 7.00% | 10.30% | 14.90% |
| 49 | Austin, TX | 58.80% | 85.40% | 59.30% | 6.40% | 3.00% | 5.90% |
| 14 | Baltimore, MD | 67.30% | 93.60% | 69.80% | 15.10% | 22.20% | 11.00% |
| 6 | Birmingham, AL | 69.50% | 84.80% | 67.40% | 3.70% | 4.80% | 6.00% |
| 42 | Boston, MA-NH | 61.50% | 93.90% | 69.40% | 30.10% | 20.60% | 16.60% |
| 23 | Buffalo, NY | 66.10% | 91.50% | 58.40% | 20.80% | 10.00% | 6.60% |
| 25 | Charlotte, NC-SC | 65.80% | 84.20% | 67.30% | 6.80% | 5.20% | 5.90% |
| 28 | Chicago, IL-IN-WI | 65.40% | 91.20% | 78.10% | 27.60% | 30.00% | 25.00% |
| 9 | Cincinnati, OH-KY-IN | 69.10% | 89.80% | 63.40% | 14.40% | 11.50% | 6.00% |
| 20 | Cleveland, OH | 66.60% | 87.90% | 57.60% | 14.60% | 11.70% | 6.60% |
| 44 | Columbus, OH | 61.20% | 86.80% | 52.80% | 5.00% | 3.60% | 6.90% |
| 47 | Dallas-Fort Worth, TX | 60.20% | 85.70% | 55.80% | 4.50% | 2.90% | 3.10% |
| 34 | Denver, CO | 64.50% | 88.50% | 74.50% | 20.50% | 17.10% | 9.90% |
| 3 | Detroit, MI | 71.50% | 87.40% | 68.10% | 15.80% | 5.70% | 5.40% |
| 55 | Fresno, CA | 55.00% | 74.20% | 42.50% | 2.30% | 3.90% | 2.20% |
| 1 | Grand Rapids, MI | 72.30% | 91.90% | 68.10% | 10.30% | 6.70% | 9.50% |
| 22 | Hartford, CT | 66.50% | 94.60% | 70.70% | 20.20% | 14.20% | 6.30% |
| 51 | Honolulu, HI | 59.70% | 80.80% | 43.60% | 32.30% | 33.60% | 48.80% |
| 46 | Houston, TX | 60.50% | 84.90% | 66.80% | 5.20% | 3.40% | 4.10% |
| 14 | Indianapolis. IN | 67.50% | 87.30% | 59.40% | 6.50% | 4.00% | 2.90% |
| 16 | Jacksonville, FL | 67.20% | 85.80% | 63.30% | 15.10% | 12.70% | 11.40% |
| 31 | Kansas City, MO-KS | 65.30% | 86.10% | 47.80% | 5.70% | 4.70% | 4.90% |
| 53 | Las Vegas, NV | 57.80% | 78.90% | 66.30% | 13.10% | 3.20% | 7.60% |
| 59 | Los Angeles, CA | 47.90% | 77.90% | 55.20% | 11.00% | 10.20% | 9.00% |
| 8 | Louisville, KY-IN | 69.20% | 88.40% | 70.20% | 11.10% | 13.90% | 5.80% |
| 45 | Memphis, TN-MS-AR | 60.80% | 77.80% | 41.20% | 4.20% | 7.80% | 6.80% |
| 49 | Miami, FL | 59.90% | 85.90% | 67.80% | 26.70% | 34.40% | 38.00% |
| 48 | Milwaukee, WI | 60.10% | 90.80% | 63.30% | 16.70% | 11.30% | 8.30% |
| 4 | Minneapolis-St. Paul, MN-WI | 70.50% | 94.40% | 75.00% | 20.20% | 12.00% | 12.10% |
| 33 | Nashville, TN | 65.00% | 86.00% | 72.30% | 7.10% | 3.60% | 4.50% |
| 24 | New Orleans. LA | 65.90% | 87.50% | 42.40% | 15.50% | 6.30% | 10.30% |
| 58 | New York, NY-NJ-PA | 51.70% | 91.40% | 74.50% | 26.70% | 16.80% | 23.00% |
| 38 | Oklahoma City, OK | 63.30% | 79.50% | 37.10% | 3.40% | 1.90% | 2.70% |
| 41 | Orlando, FL | 61.90% | 84.60% | 62.50% | 12.30% | 4.90% | 6.60% |
| 18 | Philadelphia, PA-NJ-DE-MD | 66.90% | 93.60% | 72.40% | 12.80% | 11.40% | 12.70% |
| 19 | Phoenix, AZ | 66.70% | 83.90% | 72.60% | 11.40% | 9.70% | 7.20% |
| 5 | Pittsburgh, PA | 70.50% | 88.50% | 58.50% | 10.50% | 7.10% | 5.70% |
| 42 | Portland, OR-WA | 61.60% | 86.50% | 55.90% | 9.50% | 7.40% | 8.70% |
| 40 | Providence, RI-MA | 62.80% | 91.60% | 64.90% | 23.50% | 17.70% | 7.10% |
| 11 | Raleigh, NC | 67.80% | 88.50% | 61.00% | 6.40% | 6.40% | 2.70% |
| 13 | Richmond, VA | 67.60% | 86.70% | 61.90% | 10.10% | 2.50% | 6.10% |
| 26 | Riverside-San Bernardino, CA | 65.80% | 81.10% | 54.90% | 7.30% | 2.90% | 3.20% |
| 10 | Rochester, NY | 67.90% | 91.00% | 60.50% | 9.10% | 8.90% | 5.70% |
| 39 | Sacramento, CA | 62.80% | 82.20% | 44.70% | 6.90% | 3.60% | 2.50% |
| 12 | Salt Lake City, UT | 67.60% | 89.70% | 69.90% | 17.90% | 11.40% | 5.90% |
| 37 | San Antonio, TX | 63.50% | 84.70% | 47.70% | 3.30% | 1.80% | 3.60% |
| 57 | San Diego, CA | 54.50% | 81.00% | 54.20% | 16.60% | 12.40% | 12.00% |
| 54 | San Francisco, CA | 56.20% | 83.90% | 67.10% | 18.50% | 13.20% | 14.00% |
| 56 | San Jose, CA | 54.90% | 81.40% | 61.40% | 15.30% | 11.10% | 5.40% |
| 50 | Seattle, WA | 59.80% | 86.50% | 64.40% | 16.60% | 15.60% | 7.90% |
| 6 | St. Louis,, MO-IL | 69.70% | 86.80% | 63.40% | 12.80% | 11.10% | 7.10% |
| 17 | Tampa-St. Petersburg, FL | 67.00% | 84.40% | 74.20% | 20.70% | 28.20% | 21.90% |
| 29 | Tucson, AZ | 65.30% | 85.10% | 62.60% | 8.40% | 4.00% | 3.80% |
| 27 | Tulsa, OK | 65.70% | 82.90% | 42.50% | 3.30% | 2.90% | 4.40% |
| 35 | Virginia Beach-Norfolk, VA-NC | 64.20% | 86.60% | 62.80% | 9.60% | 8.10% | 7.00% |
| 36 | Washington, DC-VA-MD-WV | 63.90% | 91.20% | 76.40% | 20.20% | 25.30% | 18.40% |
| UNITED STATES | 65.20% | 86.10% | 64.50% | 14.30% | 12.60% | 13.40% | |
| Derived from American Community Survey, 2022 | |||||||


