A reader forwarded me an analysis of COVID-19 cases analyzed by the population density of California’s counties. The analysis had the concept right — if an infection is spread person to person, as in the case of COVID-19, then population density is likely to be an important “seeding” factor. That is there is virtually universal agreement that we need to practice social distancing of 6 feet or two meters to minimize the spread.
The real issue is, however, is not so much population density at the built up urban area level, or the county or city level. It is rather the exposure density that individuals experience in their daily lives. This notion was posited in a recent article, Exposure Density and the Pandemic. It matters very much how easily people’s lifestyles lend themselves to social distancing.
Appropriate Density Measures for a Pandemic
That being said, much of the academic literature on density and its impacts is at far too high a geographical level. This is because within geographical units, such as states and metropolitan areas and most counties, there is far more rural land than urban land, which severely depresses overall density figures.
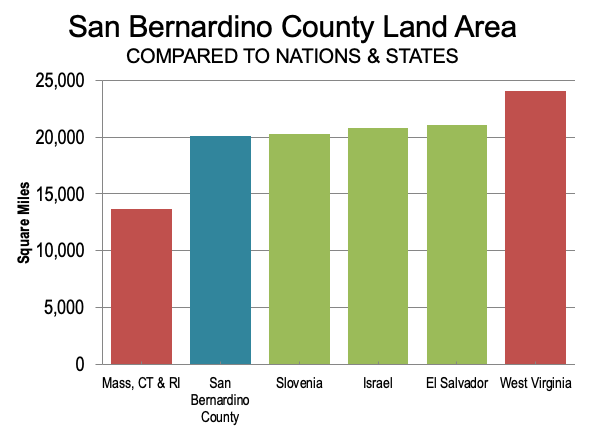
The extreme example is the nation’s largest county, San Bernardino, which has a land area of more than 20,000 square miles (52,000 square kilometers), nearly as large as the state of West Virginia (24,000 square miles/62,000 square kilometers). It is comparable in size to the nations of Slovenia, Israel and El Salvador, and exceeds the combined land area of Massachusetts, Connecticut and Rhode Island by 50 percent (Figure 1)
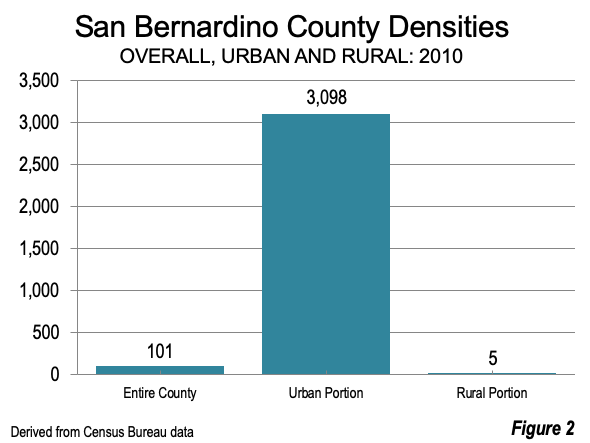
San Bernardino County’s population density is 100 per square mile (40 per square kilometer). But 97 percent of the land area is rural. San Bernardino’s urban population density (Figure 2) is 3,100 (1,200 per square kilometer), nearly as high as the urban density of Contra Costa County (3,400/1,300), just across the Bay from downtown from San Francisco. It is higher than the Marin County (2,900/1,100), which is located across the Golden Gate Bridge. The 95 percent of San Bernardino county urban residents have, all things being equal, nearly the same underlying “exposure density” of Contra Costa’s urban residents, despite the seemingly empty stretches of desert and mountains the comprise nearly all of its land area.
Counties are simply inappropriate units for any density analysis purporting to be urban. Barely one percent of counties (35) in the United States are fully urban, according to US Census Bureau data. Approximately 95 percent are more than 50 percent rural.
Exposure Density: Residential Density in San Francisco
Yet San Francisco County, co-terminus with city of San Francisco, is fully developed --- that is, it has no rural land). San Francisco County’s population density is 17,300 per square mile (6,700 per square kilometer), exceeded only by the four highest density New York City counties (boroughs), Manhattan, Kings (Brooklyn), the Bronx and Queens. But the exposure densities San Francisco residents experience range from some of the densest sections of New York to densities about as low as the overall density of San Bernardino County. There are massive differences among the county’s 197 census tracts. For example (Figure 3):
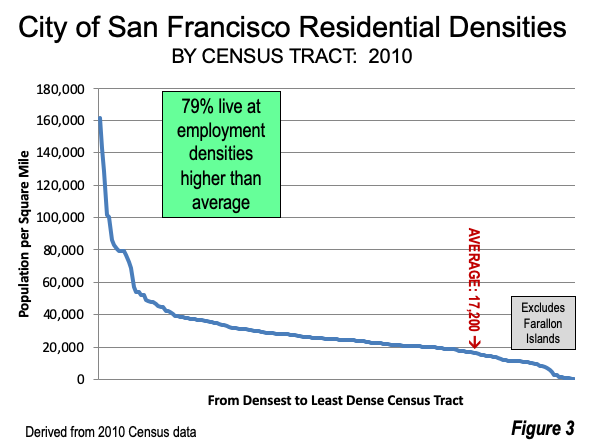
- The highest density census tract had 162,000 residents per square mile (63,000 per square kilometer), nearly nine times the county density average and 70 times the national urban average.
- The lowest density census tract had 100 per square mile. This excludes the Farallon Islands, which are about 30 miles out in the Pacific Ocean and have no permanent residents). The average urban density in the United States is more than 20 times as high, at 2,300 (900 per square kilometer).
- A resident in one of the densest census tracts is likely to have much greater exposure risk than the average San Francisco resident. Nearly 80 percent of San Franciscans live at densities above the city average. Similarly, a resident in one of the lower density census tracts is likely to have a much lower exposure risk than average.
Exposure Density: Employment in San Francisco
San Francisco had about 12,700 jobs per square mile(4,900 per square kilometer) in 2010. Yet, the differences between the 197 census tracts are even greater than the residential densities. For example (Figure 4):
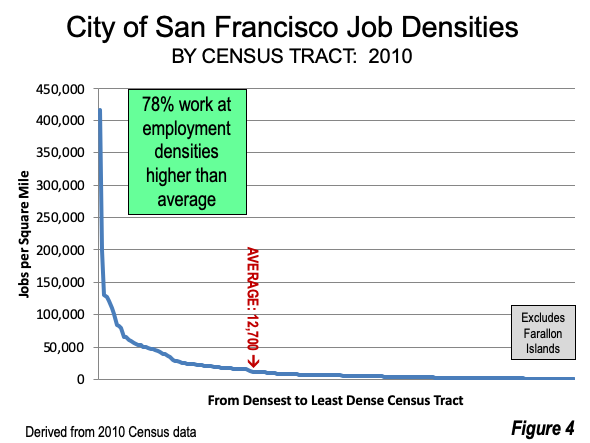
- The highest density census tract had 417,000 employees per square mile (161,000 per square mile). This is more than 30 times the city of San Francisco average. San Francisco’s maximum employment density is about 400 times the national urban average (1,000).As in the case of residents, nearly 80 percent of people employed in the city experience densities greater than the city average.
- The lowest employment density census tract is 100 workers per square mile, far below the average national urban employment density.
- An employee in one of the higher employment density census tracts is likely to have much greater exposure risk than the average. Similarly, a worker in a lower density census tract is likely to have a much lower exposure risk than average.
Comparing San Francisco and New York
San Francisco, the nation’s second densest municipality with more than 500,000 residents, has been far more successful in controlling the spread of the virus than New York City. San Francisco has some powerful advantages relative to New York.
- Part of it is the very nature of life in California. San Franciscans have a vehicle ownership rate at least 85 percent higher than in the four most densified boroughs (Manhattan, Brooklyn, the Bronx and Queens), where the crowded subways operate. Social distancing is far easier driving alone than hanging onto a strap in a crowded train.
- Residential and employment densities are far lower in San Francisco. Less than one percent of San Francisco’s population lives at hyper densities above 15,000 per square kilometer (40,000 per square mile). By contrast, more than 65 percent of New Yorkers live at this density — almost 1,000 times as many people.
This is not to suggest that these factors explain the difference in results. There will be plenty of time for more research on that.
But San Francisco and San Bernardino County illustrate the folly of gross density measures in pandemic research. This will certainly not make the regression formulas easier. But convenient, yet inferior data will do nothing to facilitate the pandemic proofing needed by our cities, from the urban core to where the development ends and the rural land begins.
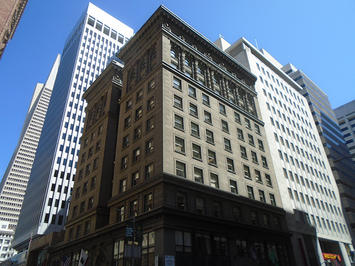
Photograph: Downtown San Francisco (by author)
Wendell Cox is principal of Demographia, an international public policy and demographics firm. He is a Senior Fellow of the Center for Opportunity Urbanism (US), Senior Fellow for Housing Affordability and Municipal Policy for the Frontier Centre for Public Policy (Canada), and a member of the Board of Advisors of the Center for Demographics and Policy at Chapman University (California). He is co-author of the "Demographia International Housing Affordability Survey" and author of "Demographia World Urban Areas" and "War on the Dream: How Anti-Sprawl Policy Threatens the Quality of Life." He was appointed by Mayor Tom Bradley to three terms on the Los Angeles County Transportation Commission, where he served with the leading city and county leadership as the only non-elected member. Speaker of the House of Representatives appointed him to the Amtrak Reform Council. He served as a visiting professor at the Conservatoire National des Arts et Metiers, a national university in Paris.


