The US Census Bureau has reported that eight of the fifteen 2011-2012 fastest-growing municipalities with at least 50,000 population were in Texas. Three of them were in the Austin metropolitan area. San Marcos, south of Austin, grew the fastest in the nation at 4.9 percent. Cedar Park, located in Austin's northern suburbs, ranked fourth in growth at 4.7 percent while Georgetown, also north of Austin grew 4.2 percent and ranked seventh. Houston suburb Conroe placed 10th adding 4.0 percent to its population. Dallas-Fort Worth suburbs McKinney and Frisco placed 11th and 12th. The other two Texas municipalities ranking high were outside the major metropolitan areas, Midland (third) and Odessa (13th).
Growth Outside Texas
South Jordan, located in the southern suburbs of the Salt Lake City metropolitan area was the second fastest-growing municipality, at 4.9 percent. Atlanta suburb Alpharetta grew 4.4 percent and ranked sixth. The largest municipality among the fastest-growing was Irvine, an Orange County suburb in the Los Angeles metropolitan area, which grew 4.2 percent to a population of 230,000. Buckeye, a suburb on the western periphery of the Phoenix metropolitan area placed ninth, growing 4.1 percent.
Among the above 11 fastest-growing suburbs in major metropolitan areas, all are either near the periphery of the urban area or beyond the principal urban area. This illustrates the historic tendency of the fastest-growing city sectors to be located on (or beyond) their fringes. This was also strongly evident in the 2000 to 2010 census data, which showed 94 percent of major metropolitan area growth to be 10 miles or more from the urban cores.
Other fast growers were not in major metropolitan areas, including Midland, Texas, Odessa, Texas, Auburn, Alabama and Manhattan, Kansas. Clarksville, Tennessee grew fifth-fastest. Clarksville is the core city of the second fastest-growing metropolitan area in the nation, just north of Nashville.
First Census Bureau Municipal Estimates Since 2010
These were the first reliable municipality (sub-county) population estimates produced by the Census Bureau since the 2010 census. The 2011 municipality estimates were virtually meaningless, since they were simply percentage allocation of county growth to municipalities based upon their share of the 2010 population.
Growth in the Major Metropolitan Core Cities
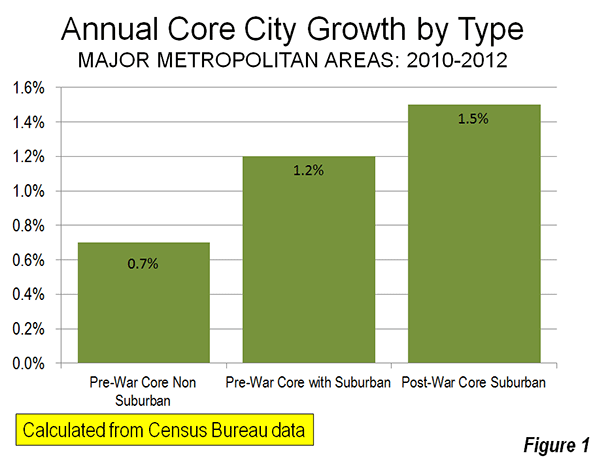
Nonetheless, over the past two years the greatest historical core municipality growth has been in those with the most suburban (Figure 1) land use characteristics. (See Suburbanized Core Cities for discussion of how “Historical Core Cities” are defined).

Pre-War & Non Suburban Core Cities: The least suburban core cities, those with little postwar suburban development, grew 0.7 percent between 2010 and 2012. The strongest growth in this category was in Washington, which added 2.2 percent annually. In reaching a population of 634,000, Washington passed nearby Baltimore for the first time in its history. New York added the largest number of people in the category at 162,000.
Pre-War and Suburban Core Cities: The Pre-War Core cities with large tracts of post-war suburban development grew at a 1.2 percent annual rate (Note 1). In this category, New Orleans grew the fastest, at an annual rate of 3.2 percent, as it continues to recover from Hurricane Katrina. Denver also grew strongly, at an annual rate of 2.5 percent.
Post-War & Suburban Core Cities: These core cities, none of which had strong urban cores before World War II and which are virtually all suburban, grew at an annual rate of 1.5 percent. Austin, which is at the core of the fastest-growing major metropolitan area in the United States, grew the fastest in this category, at 2.9 percent.
Metropolitan, Core City and Suburban Trends
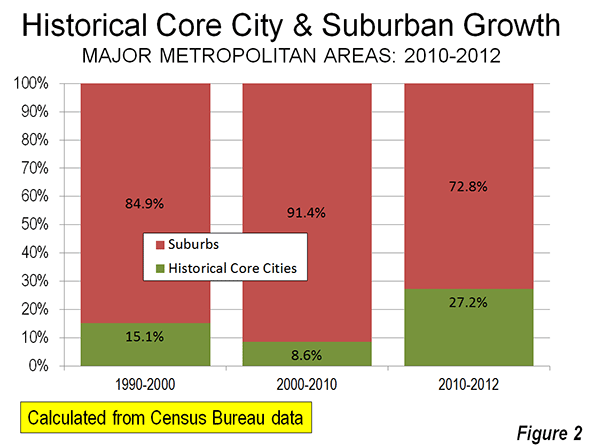
The estimates also indicate that the suburban population boom that accompanied the housing bubble has run its course. During the 2000s, the share of major metropolitan area (over 1 million population) growth in historical core municipalities fell to approximately one-half the rate of the 1990s. That picked up in the late 2000s as housing construction came to a near standstill and the slower suburban growth rates that have continued through to 2012.
In a few metropolitan areas, historical core municipalities attracted the majority of the population growth. The leader in this regard was Providence, with 75 percent of its metropolitan growth, which was miniscule. New Orleans captured nearly 2/3 of the growth in its metropolitan area, while New York accounted for 61 percent of its metropolitan area growth. San Antonio, San Jose, and Columbus also attracted more than one half of their metropolitan area growth, though the high share of core-city growth in San Jose and San Antonio was reflective of their high population shares (Table 1).
Between 2000 and 2012, historical core municipalities accounted for 27.2 percent of the growth in major metropolitan areas (Figure 2). This is slightly more than their 26.4 percent of the population in 2010. It would be a mistake to interpret this as presaging the long predicted "return to the city." It would take a continuation of these growth rates for nearly 500 years for historical core municipality populations to struggle to 30 percent of the major metropolitan area population. At the same time, there have been recent indications of even more dispersion, as major metropolitan areas lost nearly two million domestic migrants to smaller areas between 2000 and 2011, according to Census Bureau data.

Further, the trends in domestic migration indicate that people continue to move to the suburbs from elsewhere, while moving away from the core counties (migration data is not available below the county level). Overall, the core counties of major metropolitan areas lost 167,000 domestic migrants, while the suburban counties added 286,000 (Note 2).
The domestic migration losses in some core counties were substantial. In the five counties that constitute New York, there was a loss of 139,000 domestic migrants (there was also a loss of 114,000 domestic migrants in the suburbs). Los Angeles County lost 111,000 domestic migrants, while Chicago's Cook County lost 74,000. The largest gainers were in Austin (Travis County: 36,000), Atlanta (Fulton County: 32,000) and San Antonio (30,000). Core counties continued to attract most international migration, adding 757,000, compared to 589,000 in the suburban counties (Table 2).
The Future?
It seems apparent that the nation's growth continues to be in a transitional period. Should a more normal and vibrant economy replace the current malaise, it seems likely that suburban growth will be renewed. That would not, however, preclude a continuation of the recent smaller inner-core population growth in the increasingly safer and more attractive downtown areas.
| Table 1 | |||||
| Metropolitan and Historical Core CityPopulation: 2010-2012 | |||||
| Metroplitan Area | Metropolitan Area | Change | Historical Core City(s) | Change | Share of Growth |
| Atlanta, GA | 5,457,831 | 171,099 | 443,775 | 23,496 | 13.7% |
| Austin, TX | 1,834,303 | 118,017 | 842,592 | 51,955 | 44.0% |
| Baltimore, MD | 2,753,149 | 42,660 | 621,342 | 381 | 0.9% |
| Birmingham, AL | 1,136,650 | 8,600 | 212,038 | (250) | -2.9% |
| Boston, MA-NH | 4,640,802 | 88,400 | 636,479 | 18,885 | 21.4% |
| Buffalo, NY | 1,134,210 | (1,301) | 259,384 | (1,926) | |
| Charlotte, NC-SC | 2,296,569 | 79,534 | 809,798 | 21,221 | 26.7% |
| Chicago, IL-IN-WI | 9,522,434 | 61,329 | 2,714,856 | 19,258 | 31.4% |
| Cincinnati, OH-KY-IN | 2,128,603 | 14,023 | 296,550 | (400) | -2.9% |
| Cleveland, OH | 2,063,535 | (13,705) | 390,928 | (5,886) | |
| Columbus, OH | 1,944,002 | 42,037 | 809,798 | 21,221 | 50.5% |
| Dallas-Fort Worth, TX | 6,700,991 | 274,781 | 1,241,162 | 43,329 | 15.8% |
| Denver, CO | 2,645,209 | 101,731 | 634,265 | 34,241 | 33.7% |
| Detroit, MI | 4,292,060 | (4,187) | 701,475 | (12,302) | |
| Grand Rapids, MI | 1,005,648 | 16,710 | 190,411 | 2,371 | 14.2% |
| Hartford, CT | 1,214,400 | 2,016 | 124,893 | 118 | 5.9% |
| Houston, TX | 6,177,035 | 256,579 | 2,160,821 | 63,604 | 24.8% |
| Indianapolis. IN | 1,928,982 | 41,105 | 834,852 | 14,410 | 35.1% |
| Jacksonville, FL | 1,377,850 | 32,254 | 836,507 | 14,723 | 45.6% |
| Kansas City, MO-KS | 2,038,724 | 29,386 | 464,310 | 4,523 | 15.4% |
| Las Vegas, NV | 2,000,759 | 49,490 | 596,424 | 12,637 | 25.5% |
| Los Angeles, CA | 13,052,921 | 224,079 | 3,857,799 | 65,172 | 29.1% |
| Louisville, KY-IN | 1,251,351 | 15,643 | 605,110 | 7,774 | 49.7% |
| Memphis, TN-MS-AR | 1,341,690 | 16,861 | 655,155 | 8,266 | 49.0% |
| Miami, FL | 5,762,717 | 198,060 | 413,892 | 14,384 | 7.3% |
| Milwaukee,WI | 1,566,981 | 11,073 | 598,916 | 4,176 | 37.7% |
| Minneapolis-St. Paul, MN-WI | 3,422,264 | 73,405 | 683,650 | 16,004 | 21.8% |
| Nashville, TN | 1,726,693 | 55,803 | 624,496 | 20,969 | 37.6% |
| New Orleans. LA | 1,227,096 | 37,233 | 369,250 | 25,421 | 68.3% |
| New York, NY-NJ-PA | 19,831,858 | 264,451 | 8,336,697 | 161,561 | 61.1% |
| Oklahoma City, OK | 1,296,565 | 43,573 | 599,199 | 19,196 | 44.1% |
| Orlando, FL | 2,223,674 | 89,263 | 249,562 | 11,258 | 12.6% |
| Philadelphia, PA-NJ-DE-MD | 6,018,800 | 53,459 | 1,547,607 | 21,601 | 40.4% |
| Phoenix, AZ | 4,329,534 | 136,647 | 1,488,750 | 41,198 | 30.1% |
| Pittsburgh, PA | 2,360,733 | 4,448 | 306,211 | 509 | 11.4% |
| Portland, OR-WA | 2,289,800 | 63,791 | 603,106 | 19,328 | 30.3% |
| Providence, RI-MA | 1,601,374 | 522 | 178,432 | 396 | 75.9% |
| Raleigh, NC | 1,188,564 | 58,074 | 423,179 | 19,232 | 33.1% |
| Richmond, VA | 1,231,980 | 23,879 | 210,309 | 6,072 | 25.4% |
| Riverside-San Bernardino, CA | 4,350,096 | 125,245 | 213,295 | 3,343 | 2.7% |
| Rochester, NY | 1,082,284 | 2,613 | 210,532 | 20 | 0.8% |
| Sacramento, CA | 2,196,482 | 47,355 | 475,516 | 9,028 | 19.1% |
| St. Louis,, MO-IL | 2,795,794 | 8,099 | 318,172 | (1,122) | -13.9% |
| Salt Lake City, UT | 1,123,712 | 35,839 | 189,314 | 2,871 | 8.0% |
| San Antonio, TX | 2,234,003 | 91,495 | 1,382,951 | 55,346 | 60.5% |
| San Diego, CA | 3,177,063 | 81,755 | 1,338,348 | 36,727 | 44.9% |
| San Francisco-Oakland, CA | 4,455,560 | 120,169 | 1,226,603 | 30,649 | 25.5% |
| San Jose, CA | 1,894,388 | 57,477 | 982,765 | 30,203 | 52.5% |
| Seattle, WA | 3,552,157 | 112,348 | 634,535 | 25,875 | 23.0% |
| Tampa-St. Petersburg, FL | 2,842,878 | 59,635 | 347,645 | 11,936 | 20.0% |
| Virginia Beach-Norfolk, VA-NC | 1,699,925 | 23,105 | 245,782 | 2,979 | 12.9% |
| Washington, DC-VA-MD-WV | 5,860,342 | 224,110 | 632,323 | 30,600 | 13.7% |
| Total | 173,283,025 | 3,770,067 | 45,771,761 | 1,026,581 | 27.2% |
| Calculated from US Census Bureau data | |||||
| Table 2 | ||||
| Migration: Major Metropolitan Areas | ||||
| Net Domestic Migration | Net International Migration | |||
| Metroplitan Area | Core County(s) | Suburban Counties | Core County(s) | Suburban Counties |
| Atlanta, GA | 32,368 | 4,672 | 8,122 | 31,891 |
| Austin, TX | 36,045 | 30,339 | 9,536 | 2,161 |
| Baltimore, MD | (9,476) | 9,895 | 4,282 | 14,336 |
| Birmingham, AL | (6,365) | 2,141 | 1,709 | 1,119 |
| Boston, MA-NH | (2,596) | 3,109 | 14,543 | 36,407 |
| Buffalo, NY | (4,920) | (1,473) | 4,930 | 440 |
| Charlotte, NC-SC | 20,354 | 16,936 | 9,535 | 2,732 |
| Chicago, IL-IN-WI | (74,050) | (48,018) | 36,540 | 15,580 |
| Cincinnati, OH-KY-IN | (10,814) | (3,155) | 3,420 | 3,622 |
| Cleveland, OH | (24,548) | (2,628) | 6,409 | 1,382 |
| Columbus, OH | 3,116 | 2,366 | 9,220 | 1,088 |
| Dallas-Fort Worth, TX | 9,745 | 88,765 | 20,652 | 22,153 |
| Denver, CO | 17,317 | 29,839 | 3,447 | 6,393 |
| Detroit, MI | (49,741) | (706) | 7,716 | 13,973 |
| Grand Rapids, MI | 171 | 59 | 1,794 | 776 |
| Hartford, CT | (10,189) | (3,202) | 9,480 | 1,428 |
| Houston, TX | 20,101 | 50,554 | 42,096 | 12,295 |
| Indianapolis. IN | (6,523) | 11,509 | 5,561 | 2,670 |
| Jacksonville, FL | (2,000) | 12,461 | 5,991 | 1,546 |
| Kansas City, MO-KS | (6,842) | 2,624 | 1,957 | 4,711 |
| Los Angeles, CA | (110,934) | 8,439 | 88,868 | 23,635 |
| Louisville, KY-IN | (906) | 1,837 | 3,871 | 647 |
| Memphis, TN-MS-AR | (4,670) | (656) | 3,727 | 261 |
| Miami, FL | 26 | 44,255 | 66,308 | 44,873 |
| Milwaukee,WI | (11,271) | 662 | 3,740 | 911 |
| Minneapolis-St. Paul, MN-WI | 2,706 | (4,786) | 11,583 | 11,424 |
| Nashville, TN | 6,117 | 19,203 | 5,357 | 2,714 |
| New Orleans. LA | 19,061 | (585) | 1,439 | 4,262 |
| New York, NY-NJ-PA | (139,190) | (114,335) | 151,431 | 117,636 |
| Oklahoma City, OK | 7,494 | 12,791 | 3,335 | 1,432 |
| Orlando, FL | 16,507 | 15,163 | 21,115 | 10,779 |
| Philadelphia, PA-NJ-DE-MD | (14,535) | (18,095) | 16,276 | 22,104 |
| Phoenix, AZ | 42,243 | 4,716 | 18,971 | 413 |
| Pittsburgh, PA | 3,114 | 4,050 | 5,006 | 783 |
| Portland, OR-WA | 9,266 | 14,323 | 5,055 | 7,153 |
| Providence, RI-MA | (9,263) | (5,050) | 6,428 | 2,988 |
| Raleigh, NC | 25,546 | 3,409 | 7,207 | 568 |
| Richmond, VA | 1,965 | 3,781 | 1,656 | 4,908 |
| Riverside-San Bernardino, CA | (4,221) | 33,207 | 6,649 | 6,184 |
| Rochester, NY | (5,738) | (2,222) | 4,392 | 583 |
| Sacramento, CA | (2,086) | 6,472 | 11,150 | 3,172 |
| St. Louis,, MO-IL | (7,666) | (14,640) | 2,322 | 6,677 |
| Salt Lake City, UT | 1,486 | 47 | 5,486 | 28 |
| San Antonio, TX | 30,130 | 16,031 | 7,417 | 604 |
| San Francisco-Oakland, CA | 1,736 | 17,103 | 12,294 | 36,783 |
| San Jose, CA | (7,029) | 476 | 30,315 | 104 |
| Seattle, WA | 21,616 | 5,003 | 26,670 | 9,748 |
| Tampa-St. Petersburg, FL | 20,153 | 15,875 | 12,823 | 7,086 |
| Virginia Beach-Norfolk, VA-NC | (4,405) | (7,859) | 3,269 | 10,065 |
| Washington, DC-VA-MD-WV | 14,170 | 21,026 | 6,199 | 73,365 |
| Total | (163,363) | 285,728 | 798,480 | 588,593 |
| Calculated from US Census Bureau data | ||||
Wendell Cox is a Visiting Professor, Conservatoire National des Arts et Metiers, Paris and the author of “War on the Dream: How Anti-Sprawl Policy Threatens the Quality of Life.
-----
Note 1: See 2010 historical core municipality list. This list does not include Grand Rapids, which now exceeds 1,0000,000 population as a result of the new metropolitan definitions, and is classified as Pre-War Core and Suburban.
Note 2: Excludes the Las Vegas and San Diego metropolitan areas, which have only one county.
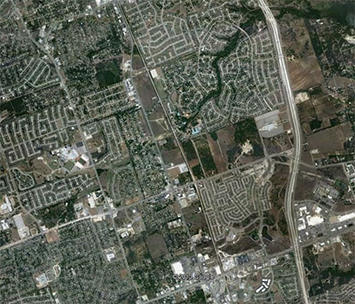
Photo: Google Earth image of Cedar Park, Texas


Texas Population
In USA the top population growing rate is in Texas. get him back permanently
Population Growth
In USA there is lowest population Growth rate as compare to other countries. get ex boyfriend now
It is good to see the Texas
It is good to see the Texas Subtown are getting more population than any other country. Hope this will increase purchasing power
Old School New Body review
Population
We as a nation help to lower down the population rate. attract your ex girlfriend back
I have realized that car
I have realized that car insurance organizations know the cars and trucks which are prone to accidents and other risks. Additionally , they know what form of cars are given to higher risk along with the higher risk they've already the higher your premium fee. Understanding the easy basics involving car insurance will allow you to choose the right types of insurance policy that may take care of your preferences in case you get involved in any accident. Many thanks for sharing your ideas with your blog.
The Tao of Badass Exposed In This Unbiased Review
This is good news and bad
This is good news and bad news as well. Good news is the purchasing power will grow and bad news is price of commodity will go up
Click This Link
Thanks for sharing updated
Thanks for sharing updated stats with us. I am very shocked to see population in some states.
Acne No More Reviews
Grand Rapids gained lots of
Grand Rapids gained lots of new population due to new rules and regulation. Now I feel our policy makers will think about its development as well.
Text The Romance Back Download
Texas Suburbs leads to
Texas Suburbs leads to population growth because many people are shifting to these areas for more job opportunities.
Tinnitus Miracle Reviews
Interesting post. I Have
Interesting post. I Have Been wondering about this issue, so thanks for posting. Pretty cool post.It 's really very nice and Useful post.Thanks
things to do to get my ex girlfriend back