
When you think of financial services, one usually looks at iconic downtowns such as New York’s Wall Street, Montgomery Street San Francisco's or Chicago’s LaSalle Street. But since the great financial crisis of 2007-8 the banking business is on the move elsewhere. Over the last five years (2007 to 2012), even as the total number of financial jobs has declined modestly, they have been growing elsewhere.
This is the conclusion of an analysis of data supplied by Moody's Analytics for an article in The Wall Street Journal ("Meet Them in St. Louis: Bankers Move). This analysis adjusts the data provided by Moody's Analytics, combining portions of metropolitan areas (called "metropolitan divisions")into their complete metropolitan areas (See Note 1).
The financial sector tends to be comparatively concentrated. In 2007, approximately one-third of the financial sector jobs reported by Moody's were located in the New York metropolitan area. New York is the home of one of world's largest financial sector hubs, Manhattan.
New York: Financial Sector Employment Losses and Dispersion
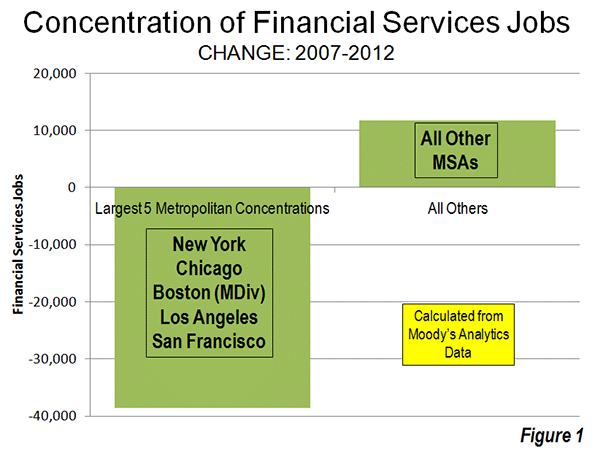
However, the New York metropolitan area and the other four largest concentrations of financial sector jobs – New York, Chicago, Boston, Los Angeles and San Francisco – accounted all of the net job losses over the period. Between 2007 and 2012, the five largest financial sector markets, lost 39,000 jobs. Outside these five metropolitan areas, the number of financial sector jobs increased by 12,000 (Figure 1).
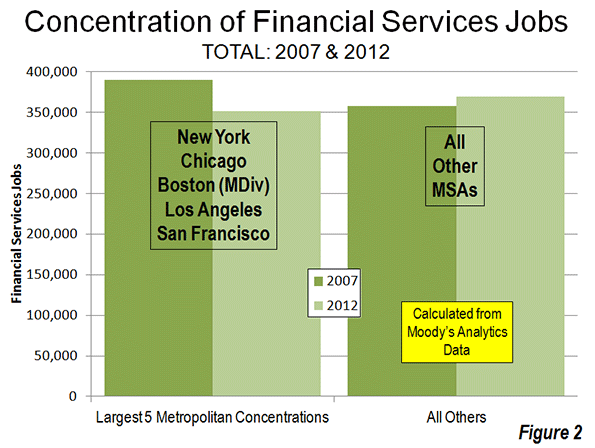
The extent of this dispersal away from the five most concentrated markets is illustrated by the decline in their financial sector jobs compared to the other metropolitan areas. In 2007, the five most concentrated markets had 32,000 more financial sector jobs than the other metropolitan areas. By 2012, the other metropolitan areas achieved a total number of 19,000 more financial sector jobs than the five most concentrated markets (Figure 2).
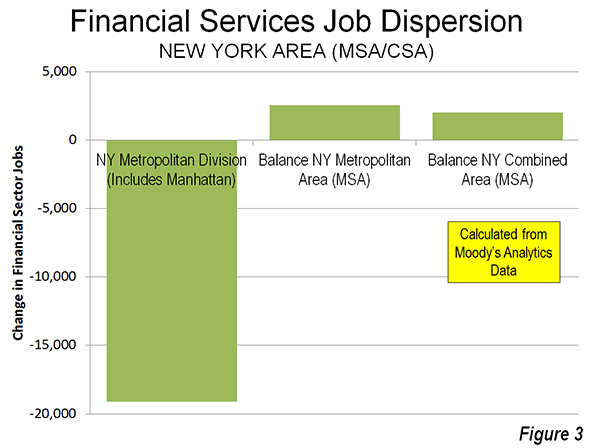
The dispersion of financial sector jobs is evident even within the New York area itself. The central metropolitan division of the New York metropolitan area (New York-White Plains-Wayne), which includes Manhattan, lost 19,000. However, the balance of the New York metropolitan area experienced a 2500 increase in financial sector jobs, resulting in a overall loss of 16,500 jobs in the metropolitan area
Not all of the New York metropolitan area jobs were lost to places like Dallas-Fort Worth and Des Moines. The balance of the New York combined statistical area (formerly called consolidated metropolitan statistical areas) added 2000 jobs, principally in the Bridgeport (Fairfield County, Connecticut) metropolitan area (Figure 3). Thus, while the core of the New York metropolitan area was losing 9 percent of its financial sector jobs, the more suburban balance of the combined area gained 11 percent, even as the total region lost employment.
California: Substantial Financial Sector Employment Losses
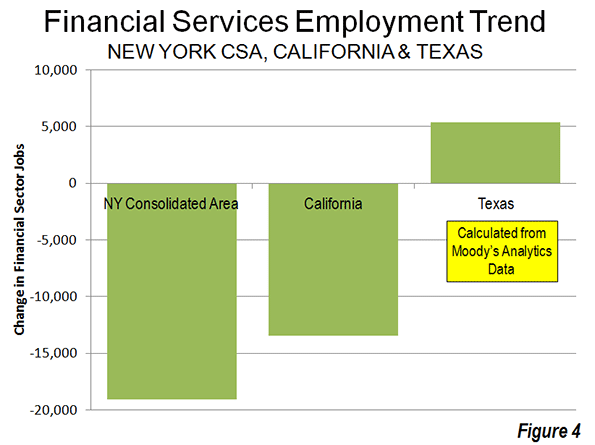
However, New York's percentage losses paled by comparison to those in the Los Angeles (Los Angeles and Riverside-San Bernardino) and San Francisco combined (San Francisco and San Jose) statistical areas. The losses in the Los Angeles area were 21 percent, while in the San Francisco area the losses reached 17 percent. The losses in Los Angeles and San Francisco regions exceeded that of the New York combined statistical area, which had three times as many financial sector jobs in 2007. San Diego also experienced a 5percent job loss, while Sacramento's loss was miniscule. Overall, California lost 17 percent of its financial sector jobs between 2007 and 2012.
Texas: Gaining Financial Sector Employment
The large metropolitan areas of Texas and did better. Dallas-Fort Worth, Houston, San Antonio and Austin added 5400 financial sector jobs, an increase of 14 percent (Figure 4).
Metropolitan Area Performance
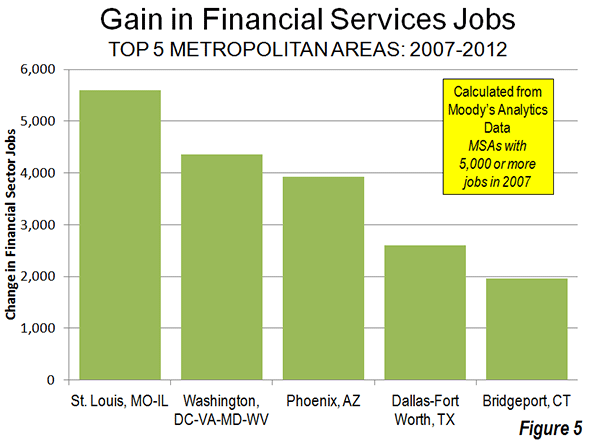
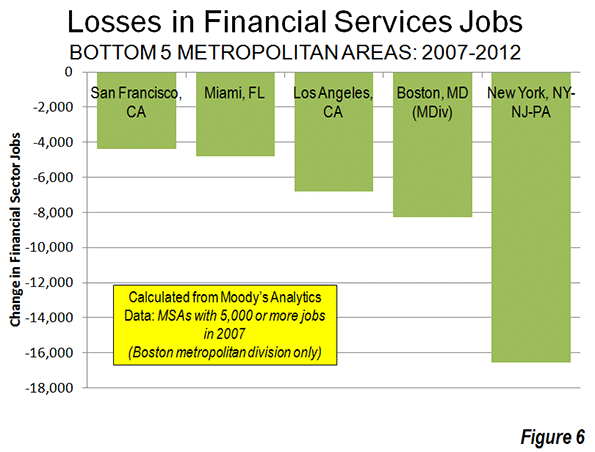
St. Louis added 5,600 financial sector jobs, the most of any single metropolitan area (Figure 5). The Washington area added 4,400, followed by Phoenix (3,900), Dallas-Fort Worth (2,600) and Bridgeport (2,000). New York, as mentioned above, lost 16,500 financial sector jobs, the most of any individual metropolitan area (Figure 6). Boston had the second largest loss (8,300), followed by Los Angeles (6,800), Miami (4,800) and San Francisco (4,400).
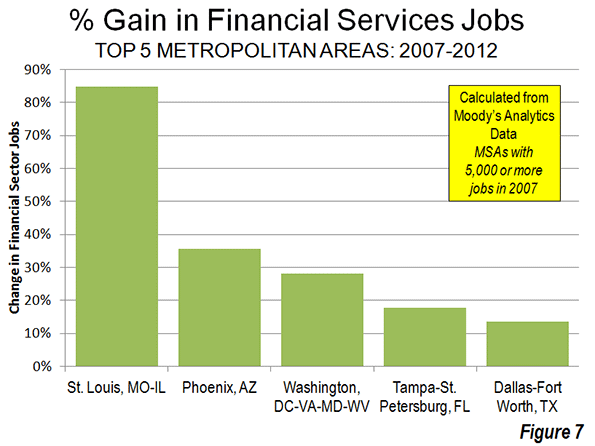
The metropolitan areas with the largest percentage gains include net job leader St. Louis which grew 85 percent (Figure 7). Phoenix gained 36 percent, Washington 28 percent, Tampa-St. Petersburg 18 percent and Dallas-Fort Worth 14 percent. Des Moines, which had only 1,400 financial sector jobs in 2007 had the largest percentage gain, at 96 percent.
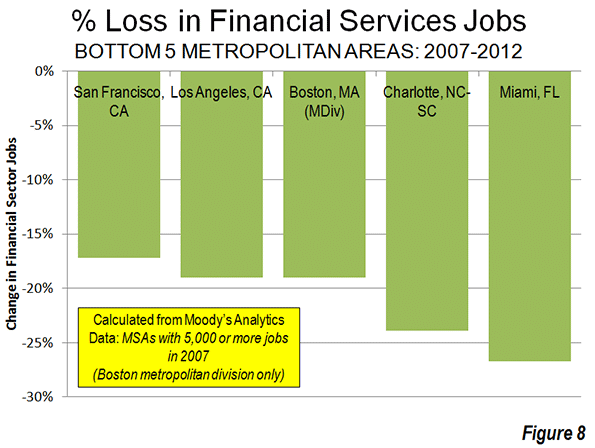
Miami had the largest loss, at 27 percent (Figure 8). Charlotte, having risen to prominence with its large banks may have been in the wrong place at the wrong time, losing 24 percent of its financial sector jobs, followed by Boston and Los Angeles (19 percent) and San Francisco (17 percent).
Dispersing to Lower Density Areas
The data is not sufficiently precise to distinguish between central business district, urban core and suburban trends. However, the metropolitan areas with high density historical core municipalities (above 10,000 persons per square mile or 4,000 per square kilometer in 2010), suffered a loss of 35,000 financial sector jobs between 2007 and 2012, more than the total national metropolitan loss of 27,000. The six high density historical core municipalities (Note 2) include New York, Chicago, Philadelphia Boston, San Francisco and Miami all suffered significant losses while the metropolitan areas with less dense cores gained 9,000 financial sector jobs (Figure 9).
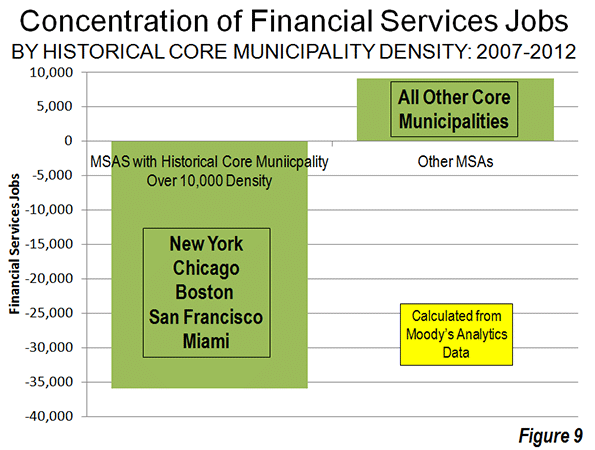
Further, the losses were concentrated in the metropolitan areas with the four most dense major urban areas, Los Angeles, San Francisco, San Jose and New York and the losses in these areas exceeded the overall industry loss. This movement away from density reinforces the often misconstrued conclusions of the Santa Fe Institute Urban Scaling research to the effect that metropolitan area size was a principal determinant of productivity, however not urban density (see: Density is Not the Issue: The Urban Scaling Research). Larger, less dense regions did far better --- for example Houston, Dallas and St. Louis --- than their more dense rivals.
Dispersion to Housing Affordability
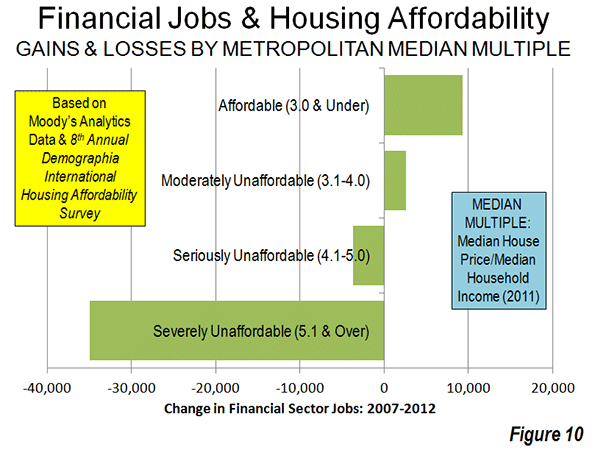
There is also a strong trend of financial sector job gains where housing is more affordable and job losses where housing is less affordable. This is indicated by the median multiple (median house price divided by gross median household income) data from the 8th Annual Demographia International Housing Affordability Survey (Table below).
|
Demographia International Housing Affordability Survey Housing Affordability Rating Categories |
|
|
Rating |
Median Multiple |
|
Severely Unaffordable |
5.1 & Over |
|
Seriously Unaffordable |
4.1 to 5.0 |
|
Moderately Unaffordable |
3.1 to 4.0 |
|
Affordable |
3.0 & Under |
Metropolitan areas rated as affordable (median multiple 3.0 or lower) gained 9,300 financial sector jobs between 2007 and 2012. Metropolitan areas rated moderately unaffordable (median multiple 3.1 to 4.0) gained 2,600 jobs. The metropolitan areas with the most unaffordable housing suffered a net loss in financial sector jobs. Seriously unaffordable (median multiple 4.1 to 5.0) metropolitan areas lost 3,700 jobs. Metropolitan areas rated seriously unaffordable (median multiple 5.1 or higher) lost 35,000 jobs. This is more than the overall loss reported in the data of 27,000 (Figure 10).
Financial Sector Jobs: Reflecting Urban Dispersion
The dispersion of financial sector jobs away from concentrated areas may come as a surprise, given the close association that the industry has with the largest central business districts. Yet, the trend mirrors the more general, but overwhelming trends of dispersion indicated over the last decade in both population and domestic migration.
Wendell Cox is a Visiting Professor, Conservatoire National des Arts et Metiers, Paris and the author of “War on the Dream: How Anti-Sprawl Policy Threatens the Quality of Life.”
------
Note 1: The data used in this analysis is limited to that provided in The Wall Street Journal article. Data was provided for only is only for a part of the Boston metropolitan area (the Boston-Quincy metropolitan division).
Note 2: In 1940, at least 15 of the historical core municipalities had population densities exceeding 10,000 per square mile (4,000 per square kilometer)
Photo by Flickr user IABoomerFlickr


