Hong Kong is a city of superlatives. Hong Kong has at least twice the population density of any other urban area in the more developed world, at 67,000 per square mile or 25,900 per square kilometer. The Hong Kong skyline is rated the world's best by both emporis.com (a building database) and diserio.com, which use substantially different criteria. This is an honor that could not have been bestowed on any city outside New York for most of the 20th century.
No world city is better suited to mass transit than Hong Kong. Hong Kong may also be the best served --- it has the transit usage levels to prove it. According to Hong Kong 2011 census data, 87 percent of combined transit and car work trip travel in Hong Kong is by transit, though this is a small decline from the 90 percent of 2001. This is the highest transit market share of any high-income world metropolitan area.
Change in Work Access Patterns
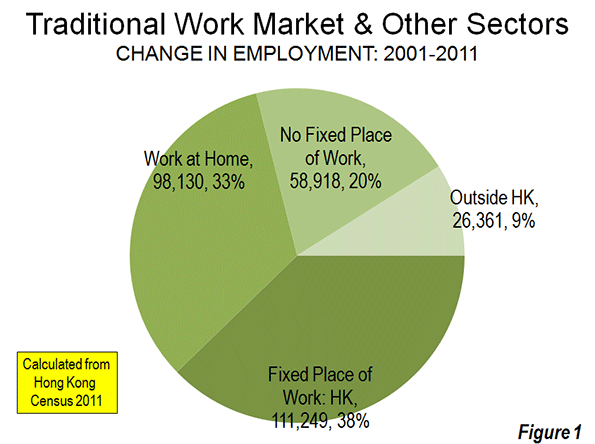
Between 2001 and 2011 Hong Kong's employment increased nine percent. Most of these new workers (38 percent), however, did not travel to fixed work locations in Hong Kong. Reflecting continuing decentralization and the impact of information technology, 62 percent of the new workers (1) worked at home, (2) had no fixed place of work or (3) worked outside Hong Kong, especially in Macau and the province of Guangdong, principally in Shenzhen (Figure 1). The 2001 and 2011 census data is summarized in the table below.
| HONG KONG WORK ACCESS: METHODS: 2001 AND 2011 | ||||||
| 2001 | 2011 | Change | % Change | Share: 2001 | Share: 2011 | |
| MASS TRANSIT | 2,091,552 | 2,226,818 | 135,266 | 6.5% | 70.4% | 70.1% |
| Bus & Coach | 1,400,770 | 1,188,897 | (211,873) | -15.1% | 47.2% | 37.4% |
| Large Bus | 1,118,388 | 938,467 | (179,921) | -16.1% | 37.7% | 29.5% |
| Minibus (Public Light) | 226,646 | 217,219 | (9,427) | -4.2% | 7.6% | 6.8% |
| Residential Coach | 55,736 | 33,211 | (22,525) | -40.4% | 1.9% | 1.0% |
| Rail | 690,782 | 1,037,921 | 347,139 | 50.3% | 23.3% | 32.7% |
| Metro (Original MTR) | 495,128 | 697,475 | 202,347 | 40.9% | 16.7% | 21.9% |
| Suburban Rail (Original KCR) | 195,654 | 297,416 | 101,762 | 52.0% | 6.6% | 9.4% |
| Light Rail | - | 43,030 | 43,030 | NA | 0.0% | 1.4% |
| CAR & TAXI | 232,978 | 333,192 | 100,214 | 43.0% | 7.8% | 10.5% |
| WALK | 335,859 | 266,574 | (69,285) | -20.6% | 11.3% | 8.4% |
| OTHER | 123,455 | 68,509 | (54,946) | -44.5% | 4.2% | 2.2% |
| TRAVEL TO HK FIXED PLACE OF WORK | 2,783,844 | 2,895,093 | 111,249 | 4.0% | 93.8% | 91.1% |
| WORK AT HOME | 185,367 | 283,497 | 98,130 | 52.9% | 6.2% | 8.9% |
| FIXED PLACE OF WORK | 2,969,211 | 3,178,590 | 209,379 | 7.1% | 100.0% | 100.0% |
| NO FIXED WORK PLACE | 188,998 | 247,916 | 58,918 | 31.2% | ||
| WORK IN HONG KONG | 3,158,209 | 3,426,506 | 268,297 | 8.5% | ||
| WORK OUTSIDE HONG KONG | 94,497 | 120,858 | 26,361 | 27.9% | ||
| WORKING RESIDENTS | 3,252,706 | 3,547,364 | 294,658 | 9.1% | ||
| EXHIBIT | ||||||
| Travel to Work in Hong Kong | 2,783,844 | 2,895,093 | 111,249 | 37.8% | ||
| Home, No Fixed Place, Outside HK | 468,862 | 652,271 | 183,409 | 62.2% | ||
| TOTAL | 3,252,706 | 3,547,364 | 294,658 | 100.0% | ||
| Source: Hong Kong Census, 2001 & 2011 | ||||||
| No Fixed Place of Work: Access method not determined | ||||||
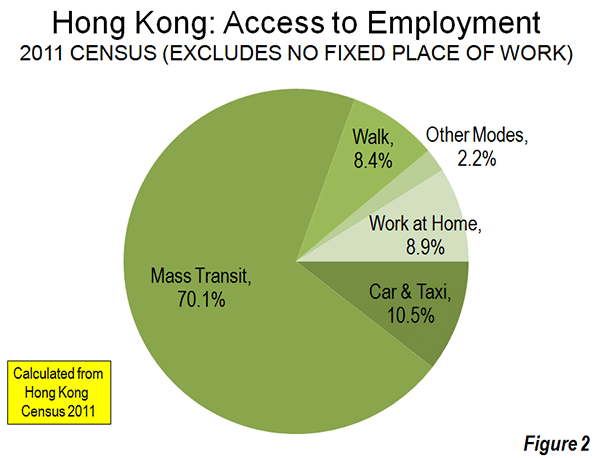
The Shift from Bus to Rail: Transit's overall share of work trip access was 70.1 percent in 2011 (all methods). This is a slight decline from the 70.4 percent in 2001. Over the last decade, Hong Kong has substantially expanded its urban rail system, including major improvements such as a new tunnel under Hong Kong Harbor and the new West rail line (former Kowloon Canton Railway) to Yuen Long and Tuen Mun. I wrote a supporting commentary in the Apple Daily (Hong Kong's largest newspaper) supporting the rail expansion program in 2000.
The results are apparent in the ridership data. The rail work access market share rose nearly 10 points to 32.7 percent. At the same time, the bus market share dropped nearly 10 points to 37.4 percent. Overall, in a modestly growing labor market, transit added 135,000 new one away work trips.
Car Commuting Up: Cars and taxis experienced a much larger percentage gain, largely as a result of starting from a much smaller base. The car and taxi work trip access market share rose from 7.8 percent to 10.5 percent. Overall, approximately 100,000 more people commuted one way by car to work in 2011 than in 2001. The median incomes of car and taxi commuters are the highest, at more than twice that of rail and bus users.
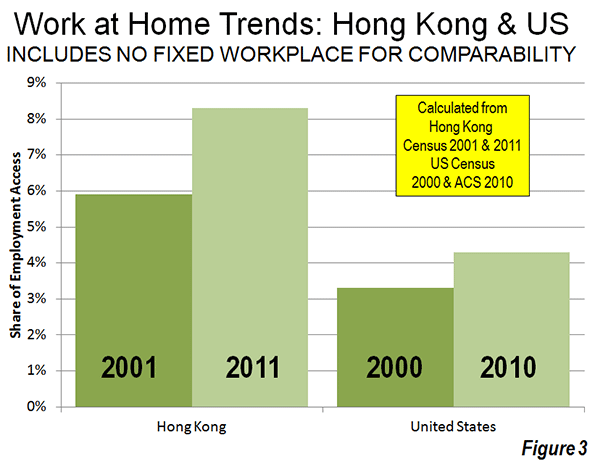
More Working at Home:Hong Kong's working at home grew the most of any category, rising 53 percent from 185,000 to 283,000 daily. As a result, working at home now accounts for 8.9 percent of work access, compared to 6.2 percent in 2001. Hong Kong's reliance on working at home was greater than that of the United States in the early 2000s. Over the last decade Hong Kong's 53 percent increase in working at home was well above the 41 percent increase in the United States. In Hong Kong, 33 percent of new employment was home-based work between 2001 and 2011. This is greater than in the US, where 20 percent of new jobs involved working at home as the usual mode of access between 2000 and 2010.
The Decline of Walking: Given Hong Kong's intensely high densities, it may come as a surprise that there was a huge loss in walking to work. Nearly 70,000 fewer people walked to work in 2011 than in 2001, as the walking market share dropped 21 percent. In 2011, commuters who walked (and those who used light rail) had the lowest incomes. In 2001, more people walked to work than either travelled by car or work at home. By 2011, fewer people walked to work than travel by car or work at home.
There was also a nearly 55,000 loss in work access by other modes (such as ferries, motorized 2-wheelers and cycling).
Finally, Hong Kong separately categorizes workers without a fixed place of employment and does not obtain information on how they access work. This category experienced an increase of nearly 60,000 from 2001 to 2011.
The Decentralization of Hong Kong's Labor Markets
The distribution of employment changed little over the 10 years, with Hong Kong Island and Kowloon sectors retaining two-thirds of the jobs. These two areas also have more than one-half of the population. Even so, the Hong Kong labor market followed the global pattern of decentralization. More people traveled outside their home areas in 2011 than in 2001. Among resident workers living on Hong Kong Island and in Kowloon, there was an 18 percent increase in working outside these home sectors. Further, the increase in people with no fixed place of work reflects greater mobility and labor force decentralization.
Jobs-Housing Balance? Not Much
The high density of jobs and population, its short trip distances, its extraordinary transit system and its high transit market share would seem to make Hong Kong a poster city for the jobs – housing balance ("self containment") that urban planners seem so intent to seek. The data indicates no such thing.
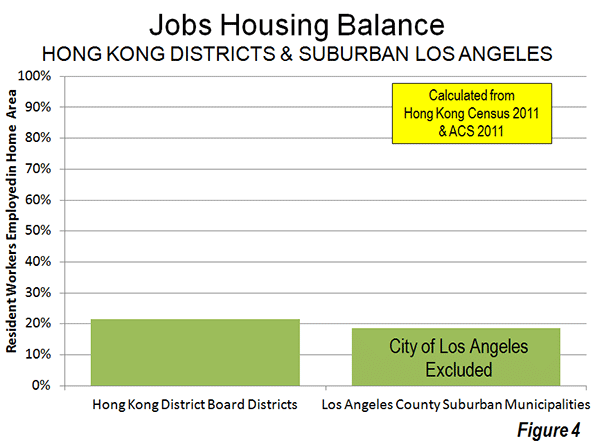
Hong Kong's 18 districts illustrate a comparatively low rate of self containment. Only 21.4 percent of working residents are employed in their home districts, including those who work at home. This is only slightly higher than in highly decentralized suburban Los Angeles County, where 18.5 percent of resident workers are employed in their home municipalities. With far lower population and employment densities and a 50 percent smaller geographical size, the suburban municipalities of Los Angeles County (city of Los Angeles excluded, see Note below) nearly equal the local-area jobs-housing balance of the Hong Kong districts (Figure 4).
This tendency to work away from home districts contributes to Hong Kong's extraordinarily long average commute times. In 2002, the average work trip was 46 minutes, longer than any high-income world metropolitan area except Tokyo. By comparison, Dallas-Fort Worth, with a similar population and a population density less than 1/20th that of Hong Kong, has an average work trip travel time of 26 minutes. Los Angeles, with its world-class traffic congestion has a work trip travel time of 27 minutes, principally because its automobile dominant commuting is much faster than Hong Kong's world class, rail based transit system.
These data, both in Hong Kong and Los Angeles, show that, within a metropolitan area (labor market), people will tend to seek the employment that best meets their needs, just as employers will hire the people best suited to theirs. Within a labor market, this can be anywhere, subject to the preferences of people and employers, not of planners. This is the basis of former World Bank principal planner Alain Bertaud's caution that a city's economic efficiency requires ... avoiding any spatial fragmentation of labor markets.
The Mistake of Trying to Emulate the Unique
It is a mistake to think that urban planning can emulate Hong Kong. Besides its superlatives, Hong Kong did not become so dense as a result of urban planning or the unfettered preferences of people (market forces). Hong Kong's uniqueness is the result of unique geo-political influences. This history forced an unprecedented accommodation of millions in a small space, especially in the third quarter of the 20th century when it stood as a capitalist island in the midst of a Communist sea.
Hong Kong is unique and will be for a long time.
Note: The city Los Angeles has a very high jobs-housing balance (61 percent). However, this is largely due to its huge geographic size (more than 40 times the average suburban jurisdiction).
Wendell Cox is a Visiting Professor, Conservatoire National des Arts et Metiers, Paris and the author of “War on the Dream: How Anti-Sprawl Policy Threatens the Quality of Life.”
----
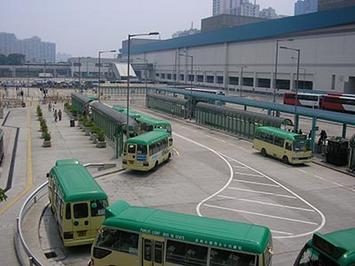
Photo: West Rail Line, Tin Shui Wai Station bus interchange, Yuen Long (by author)


'Hong Kong' Dream City
'Hong Kong' dream city for everyone! Very well developed like dreamland. Well build buildings, roads, shops,etc. Obviously this results increase in traffic.
Seo Services here
RE:Hong Kong’s Decentralizing Commuting Patterns
Well, it is true that hundreds of people from different places migrate to bigger cities like Hong Kong for bright career opportunities, and it has created acculturation, a sign of modern society. However, it has also resulted in the increase in traffic and change in living standards.
Thnaks
Adopt Hair regrowth formula
RE:Hong Kong’s Decentralizing Commuting Patterns
Well, the growing prosperity has started showing its after effects in Hong Kong. The busy roads and jumbled traffic can be seen everywhere.
Regards,
Deit
amazing
These information, both in Hong Kong and Los Angeles, display that, within a urban place (labor market), individuals will usually search for the career that best satisfies their needs, just as companies will search for the services of the individuals best best for theirs. bankingbasics
Loving the information on
Loving the information on this site, you have done outstanding job on the content .
comprar maquiagem
Hong Kong is a city of
Hong Kong is a city of superlatives. Hong Kong has at least twice the population density of any other urban area in the more developed world, at 67,000 per square mile or 25,900 per square kilometer. The Hong Kong skyline watch magi is rated the world's best by both emporis.com (a building database) and diserio.com, which use substantially different criteria. This is an honor that could not have been bestowed on any city outside New York for most of the Minamoto-kun Monogatari manga comics 20th century.
No world city is better suited to
Hong Kong is a city of
Hong Kong is a city of superlatives. Hong Kong has at least twice the population density of any other urban area in the more developed world, at 67,000 per square mile or 25,900 per square kilometer. The Hong Kong skyline is rated the world's best by both read manga online emporis.com (a building database) and diserio.com, which use substantially different criteria. This is an honor that could not have been bestowed on any city outside New York for most of the 20th century.
No world city is better suited watch anime online to
Replicating HK, cargo cult versus reality
Wendell's penultimate paragraph:
".....It is a mistake to think that urban planning can emulate Hong Kong. Besides its superlatives, Hong Kong did not become so dense as a result of urban planning or the unfettered preferences of people (market forces). Hong Kong's uniqueness is the result of unique geo-political influences. This history forced an unprecedented accommodation of millions in a small space, especially in the third quarter of the 20th century when it stood as a capitalist island in the midst of a Communist sea......"
I often say that the planning advocates are like the famous "cargo cults" among headhunter tribes in the jungle. They saw white demi-gods build an airstrip in the jungle, following which huge magic mechanical birds landed and unloaded cargoes of goodies. Therefore, they set out building replica airstrips in the jungle so the magic mechanical birds would visit them, too.
This is about as rational as expecting density mandates and public transit "investments" to turn any city into HK or Manhattan or London.
Ironically, many "thinkers" on the Left, love NYC's mass transit system, yet belong to "Occupy" movements that want to "smash Wall Street". This total intellectual failure to get the connection between historical singularities, path dependent urban economic evolution, and urban form, is what leads to the "cargo cultist", physical determinist thinking when it comes to urban planning.
If anyone really does want to replicate Hong Kong in the USA, well, the USA is not quite Mao-era Communist China, but creating a new capitalist island in the modern "liberal" leftist sea that the USA is becoming - perhaps a tax haven, free enterprise zone somewhere - very well might replicate Hong Kong quite successfully.
Increased mass transit mode share ALWAYS = more cars too
Some data I would very much like to see graphed by somebody, is outright number of car trips "by city". I believe that there is no evidence that additional numbers of population within a given area (i.e. density gains) lead to linear reductions in number of car trips relative to the lower density. I believe that as density increases, there is an increase in the proportion of the ADDITIONAL numbers of people, that use mass public transit. But I believe that there remains an increase in car use along with addition of population, the number merely converging on saturation but never "reversing".
I would suggest that the attainment of high levels of mass transit use, is always accompanied by car use rising to converge on saturation.
Work shift pattern
Big cities would definitely need a work shift patten. The best to discard a fixed work place, why not work from home as long as employees could remain productive.