Debate about immigration and the more than 38 million foreign born residents who have arrived since 1980 has become something of a national pastime. Although the positive impact of this population on the economy has been questioned in many quarters, self-employment and new labor growth statistics illustrate the increasingly important role immigrants play in our national economy.
There has also been an intense debate within the environmental community about the impact of immigrants. Yet there has been relatively little research done about how immigrants get to work and where most immigrants live. As the ‘green’ movement in the U.S. has increasingly pushed for higher-density housing and transit-oriented development in order to improve public transportation (specifically rail), few have considered how immigrants use transit and what might be the best way to accommodate their needs. In fact, all too often, “green” policies advocate transit choices – favoring such things as light rail over buses – that may work against the interests of immigrant transit riders.
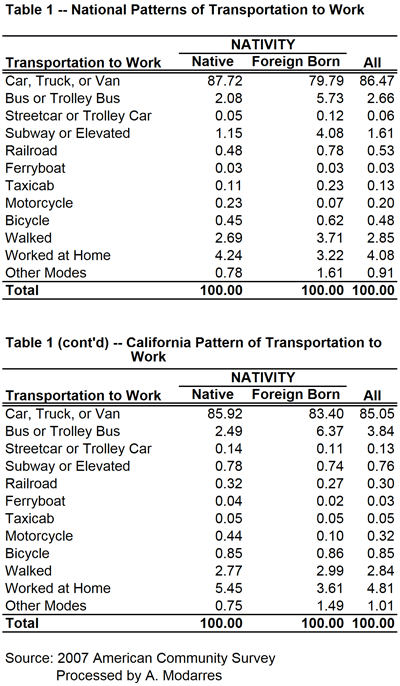 Based on the 2007 American Community Survey, 117.3 million native-born and 21.9 million foreign-born individuals commuted to work. As Table (1) illustrates, a higher percentage of immigrants rode buses (5.7% vs. 2.1%) and subways (4.1% vs. 1.2%) and many walked to work (3.7% vs. 2.7%). A much smaller percentage drove to work (79.8% vs. 87.7%). Unfortunately, despite their higher usage of alternate means of transportation to work, or perhaps because of it, the commute to work time was on average longer for the foreign-born commuters than their native-born counterparts (28.8 minutes versus 24.7).
Clearly in terms of using public transportation, immigrants are a bit greener than those born here. But why? Is this habit formed elsewhere? In that case, are recent immigrants even more likely to use public transportation than those who immigrated earlier? Or is it their income that affects their transportation choices?
Table (2) provides the answer to the first question. Recent arrivals are clearly less likely to drive to work and have a higher propensity toward using public transportation, compared to all foreign-born individuals (and significantly more than the native-born). Additionally, over 6% of the immigrants who have arrived since 2000 walk to work.
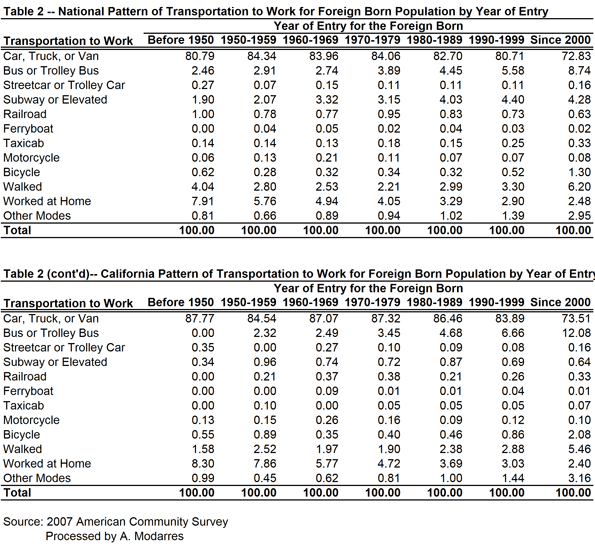
Overall, more than a quarter of the immigrants who have arrived since 2000 use an alternative mode of transportation to work. If the rest of America could do the same, we’d be a bit ‘greener’ already. However, it seems that as immigrants stay longer, they eventually tend to use cars more often because automobile usage allows for access to better jobs, better shops, and better schools. For example, immigrants who arrived in the U.S. in the 1970s (which means they have been here over three decades) drive a bit more and use public transportation less.
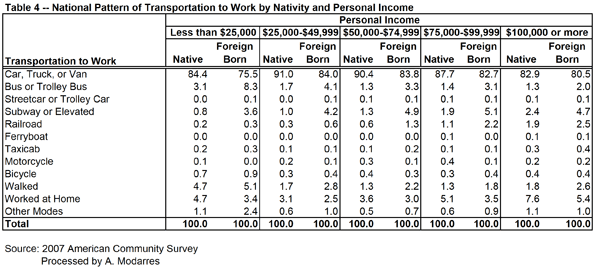
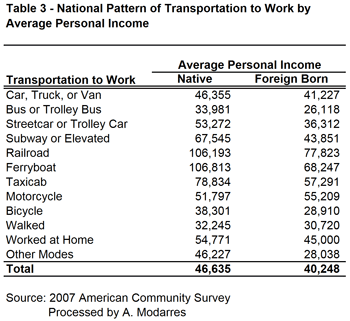 Even so, their rates are still slightly better than the native-born (compare Tables 1 and 2). This may be in part because of their lower incomes (see Table 3) yet at every level of income they are still more likely to take transit. Table (4) illustrates this point by grouping commuters into income categories and their nativity. In every income category, immigrants use their cars less and are more likely to use public transportation, even though their car ridership increases with income.
The message from these statistics is loud and clear. Immigrants are more likely to ride public transportation than those born in the U.S., regardless of their income. The ones arriving more recently are even more likely to do so. Overall, this suggests that familiarity with public transportation, combined with the effects of income and place of residence, has made the immigrants’ lives in the U.S. a bit ‘greener’ than those of the native-born. In fact, one factor that may contribute to their higher usage of public transportation stems from their living in neighborhoods whose densities are, on average, 2.5 times higher than those of the native-born. Immigrants, in essence, are doing precisely what planners want the rest of us to do.
Moving to Southern California
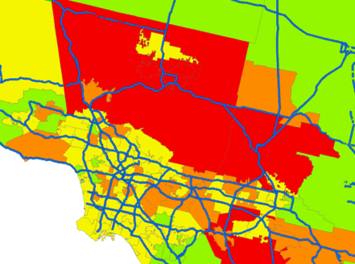
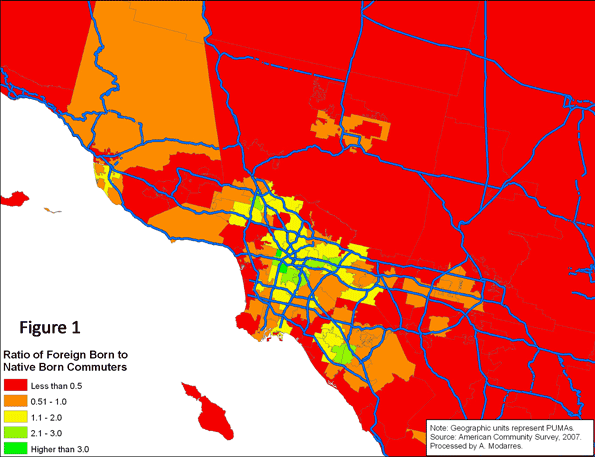
Southern California still stands as the icon of immigration and multiculturalism and is home to a large number of immigrants in the urban region that extends from eastern Ventura County to the southern tip of Orange County and the Inland Empire. As Figure (1) illustrates, in a number of neighborhoods in Southern California, the foreign-born population outnumbers the native-born by large margins. For example, in areas west and south of downtown Los Angeles, immigrants are more than three times as numerous as the native-born.
A comparison of Figures (2) and (3) suggests a wide geographic difference between the native-born and the foreign-born and how long it takes them to get to work. The foreign-born population experiences much longer commutes in highly urbanized areas around downtown Los Angeles and the San Gabriel Valley. Conversely, in the more rural areas, such as northern Ventura County, the foreign-born population experiences shorter commutes compared to their native-born counterparts.
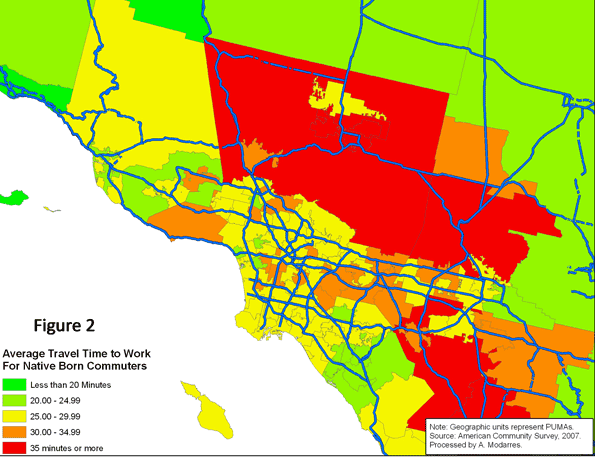
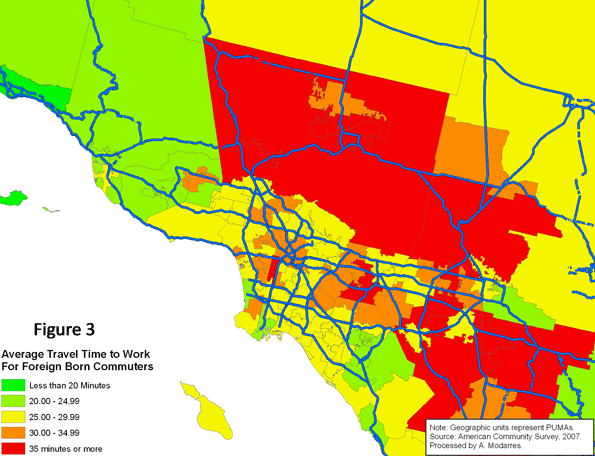
Figure (4) provides a clear comparison of average travel time to work for both populations (visually comparing Figures 2 and 3). In all areas appearing in the darkest shade of green, the foreign-born population experienced shorter commutes compared to the native-born. These shorter commutes, however rarely occur in high density areas (compare with Figure 5). Conversely, in areas such as Santa Monica, the Wilshire corridor, East Los Angeles, and southern sections of downtown Los Angeles, the foreign-born population experiences much longer commutes than the native-born.
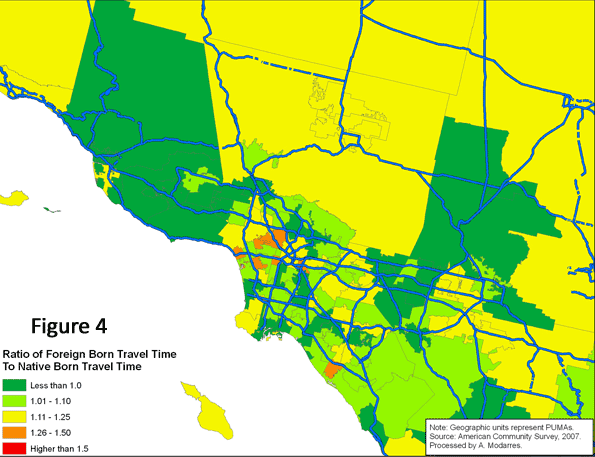
Statistically speaking, there is a positive relationship between average travel time and density – i.e., the higher the density, the higher the reported average travel time. For the foreign-born population who live in higher density areas, this means much longer commutes, a problem caused by a number of factors, including their dependency on slower public transportation systems and the long distances they have to travel to reach job centers outside the city center.
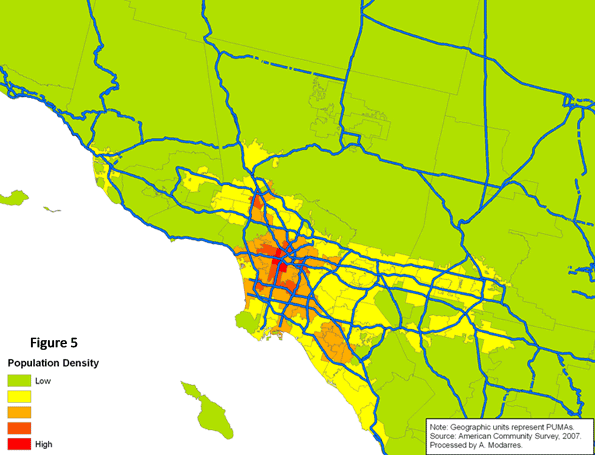
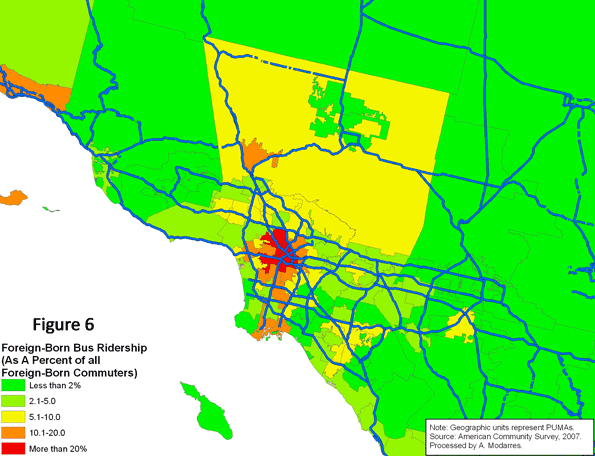
Figure (6) illustrates the geographic pattern of bus ridership among the foreign-born commuters. As with national patterns, immigrants in Southern California are more likely to settle in high density areas and use public transportation to work, but unfortunately, they also suffer much longer commutes.
What should the policy responses be? One may be to promote increased car ownership among immigrants and low-income populations in the U.S. This may be objectionable to some environmentalists and planners, but it’s clear that those people who live by the principles of higher density and public transportation use are not rewarded and indeed suffer longer commutes.
An even more relevant question is why advocates for public transportation focus disproportionately on rail, when buses are so frequently used by low income populations, including immigrants. In California, these riders outnumber the native-born on buses. The situation is reversed on rail and subways. An intelligent policy response to public transportation planning would suggest that buses should receive much more attention. Major metropolitan areas have become polycentric in their employment patterns, and most major employment centers are located at long distances from the central city. Specially-designed buses for reverse commutes could help alleviate transportation problems while helping working immigrants reach their destinations more quickly.
This challenges the priorities of some public transport advocates, who tend to focus on very expensive rail projects designed primarily to draw more middle class, largely native-born riders who commute to places like downtown Los Angeles. Meanwhile those ‘new’ Americans who already live by a number of ‘green’ standards suffer from the misallocation of transit resources. Those who are already doing what we hope the middle class will do deserve better.
Ali Modarres is an urban geographer in Los Angeles and co-author of City and Environment.


